"*" indicates required fields
"*" indicates required fields
"*" indicates required fields

October 2021
The Arrive Monthly Market Update, created by Arrive Insights, is a report that analyzes data from multiple sources, including but not limited to FreightWaves SONAR, DAT, FTR Transportation Intelligence, Morgan Stanley Research, Bank of America Internal Data, Journal of Commerce, Stephens Research, National Retail Federation and FRED Economic Data from the past month as well as year-over-year.
We know that market data is vital to making real-time business decisions, and at Arrive Logistics, we are committed to giving you the data you need to better manage your freight.
Table of Contents
(Click to scroll to section.)
Tender Volumes are representative of nationwide contract volumes and act as an indicator of Truckload Demand
Tender Rejectionsindicate the rate at which carriers reject loads they are contractually required to take and acts as an indicator of the balance between Truckload Supply and Demand
New Truck Orders is an indicator of the trucking industry’s health and carrier sentiment, as carriers typically invest in new trucks when demand and optimism are high.
Industrial Production measures the output of the industrial sector, including mining, manufacturing and utilities.
US Customs Maritime Import Shipments, China to the United States measures the total number of import shipments being cleared for entry to the U.S. from China.
Rate Spread measures the difference between the national average contract rate per mile and the national average spot rate per mile and is closely inversely correlated to movements in tender rejections and spot market volumes.
Weekly Jobless Claims are used as a barometer for the pace of layoffs in the general economy.
Unemployment Rate is the number of people who are unemployed that are actively seeking work.
"*" indicates required fields
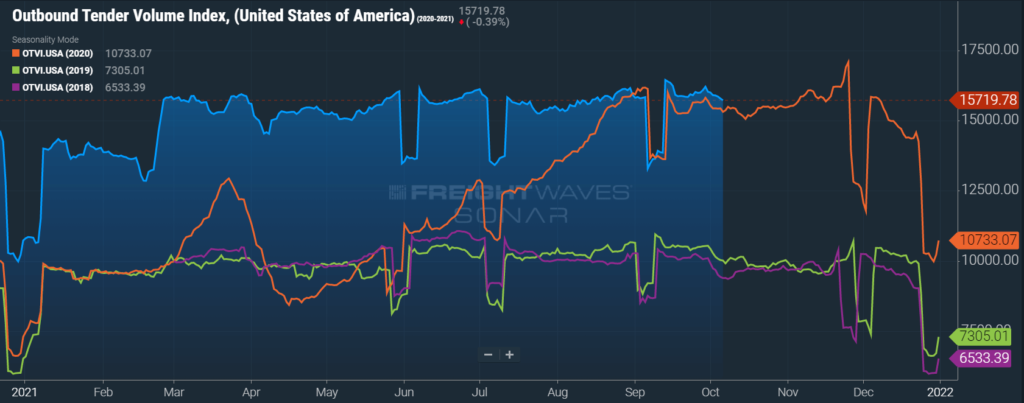
DAT reported dry van spot load posts decreased by just 1.5% month-over-month, but are still up more than 31% year-over-year in September. This is a pullback from August, where year-over-year spot load posts were up 48.6%. As we see on an annual basis, there was an end-of-month and end-of-quarter push that resulted in a spot freight jump late in September. This was apparent in the 7.8% increase in spot load posts in the final week of the month compared to the prior week.

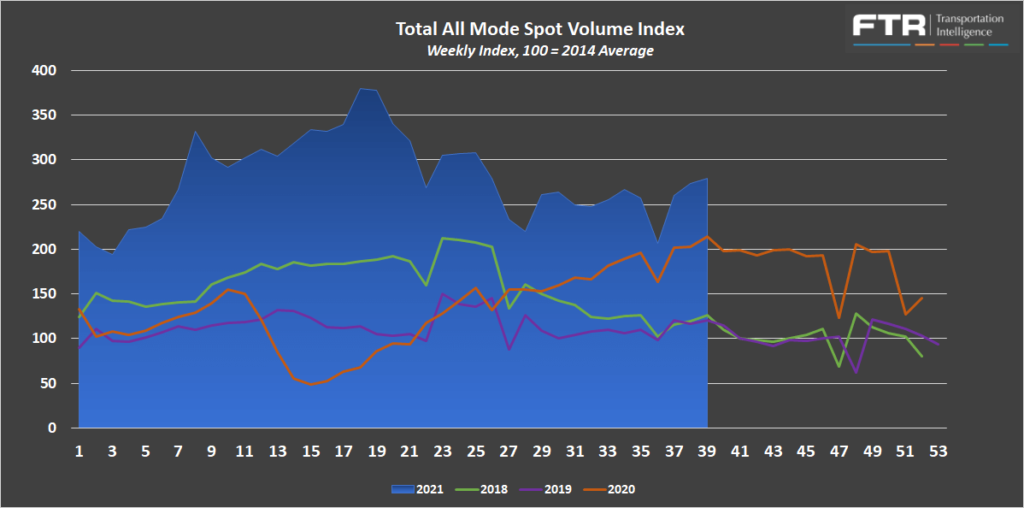
FTR and Truckstop’s Total All Mode Spot Volume Index finished September up 9% from the last week in August. The all mode index remains up 30% year-over-year, down from 112% year-over-year at the end of June, 66% at the end of July and 41% at the end of August. This is consistent with the DAT spot volume trends and is a result of rapidly rising rates a year ago more so than a pullback in volumes this year. In fact, growth was seen in all four weeks in September.
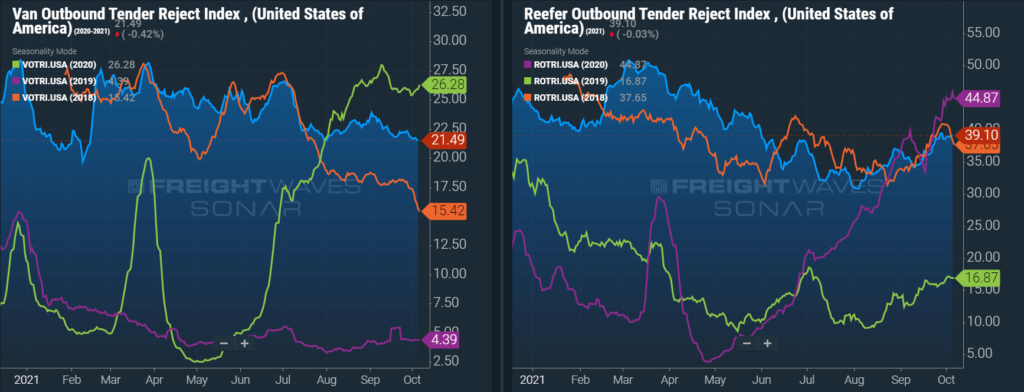
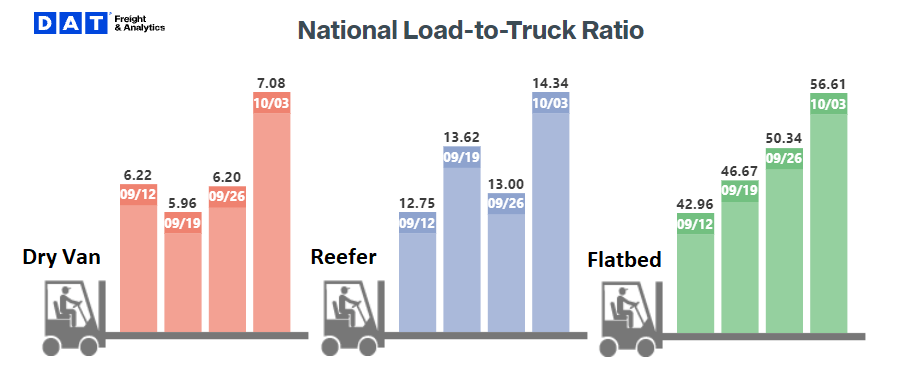
The DAT Load to Truck Ratio measures the total number of loads compared to the total number of trucks posted on their load board. In September, the Dry Van Load to Truck Ratio decreased to 6.32, down 2.2% month-over-month, but up 15.9% year-over-year. The Reefer Load to Truck Ratio decreased to 13.5, down 9.5% month-over-month, but up 39.4% year-over-year.
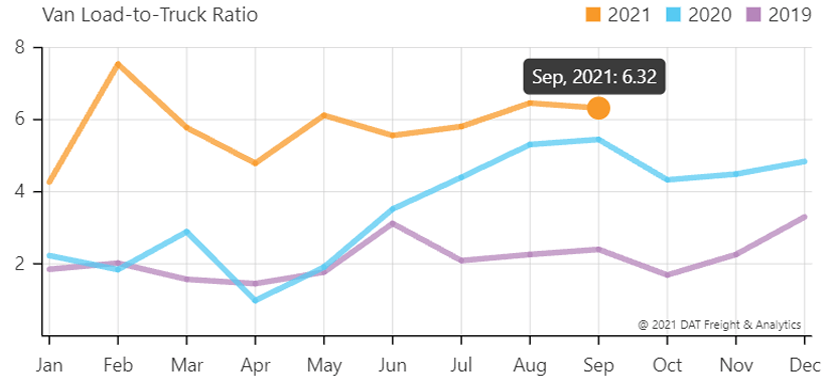
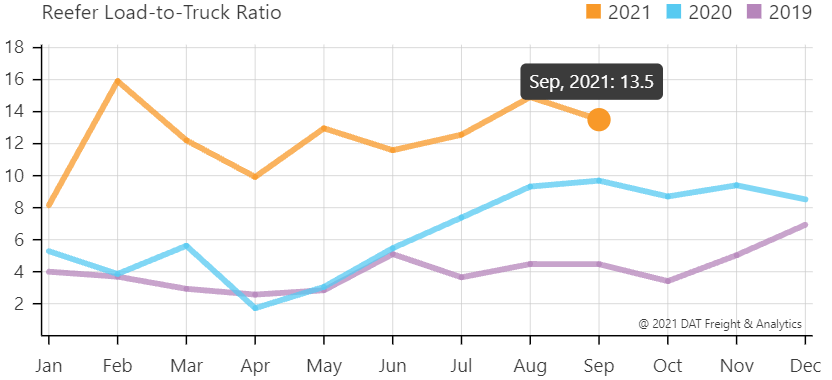
The weekly load to truck ratios show conditions tightened in the last week of the month. This is in line with the surging tender volumes associated with the increased sense of urgency amongst shippers at the end of the quarter.
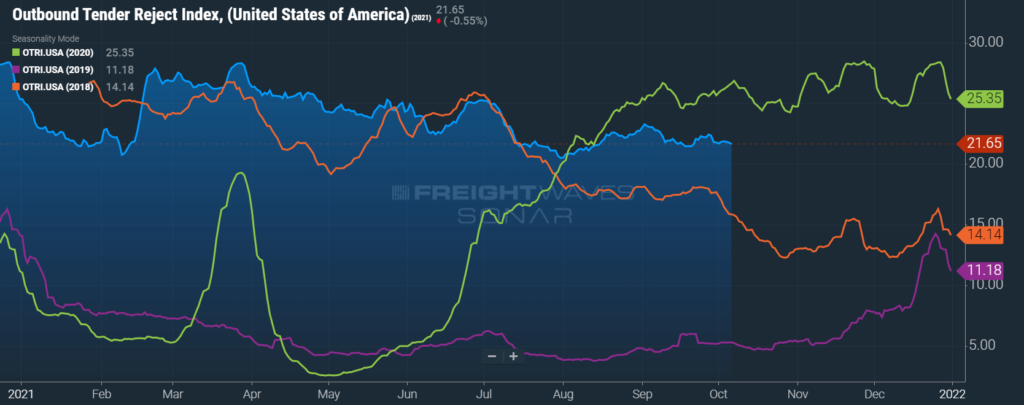
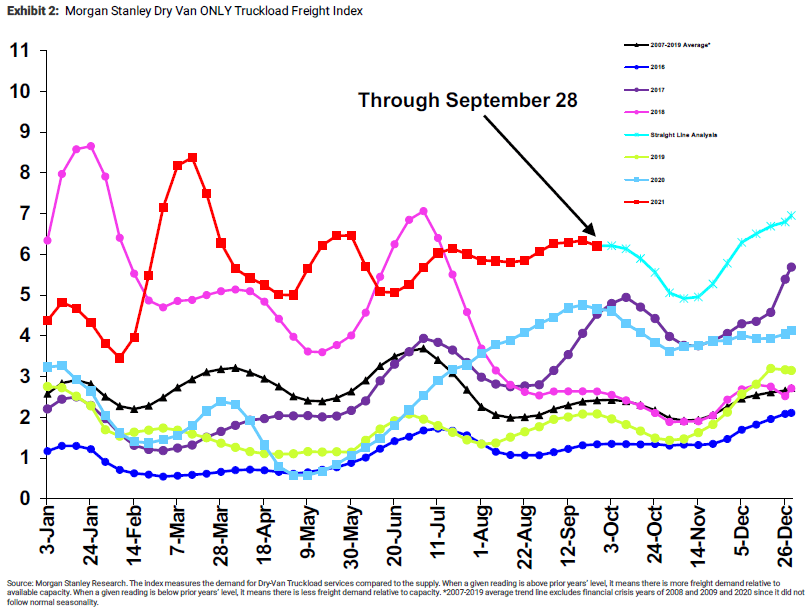
The Morgan Stanley Dry Van Freight Index is another measure of relative supply. The higher the index, the tighter the market conditions. According to the index, conditions remained mostly flat but saw some tightening as of late. Looking forward, normal seasonality indicates easing conditions throughout October and up until Thanksgiving, where we would expect to see tightening conditions throughout the remainder of the year in line with retail peak shipping season. Their straight-line forecast indicates we will see conditions finish the year well above any other year on the chart, with conditions tighter than at any point this year except in the immediate aftermath of the February winter storms.
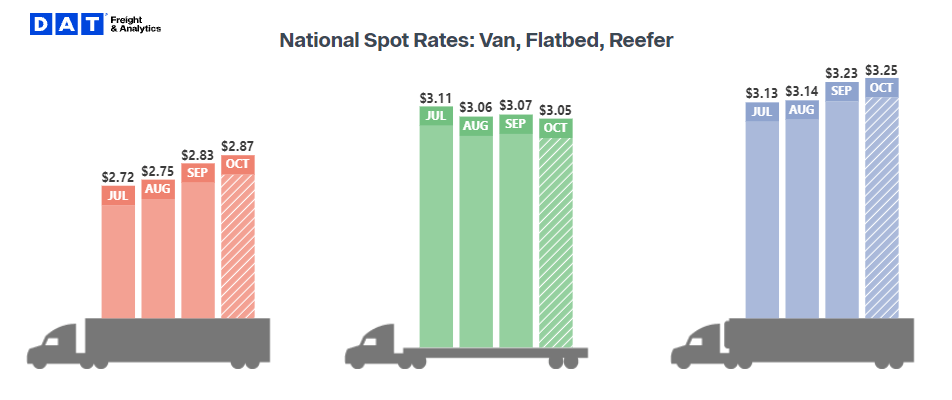
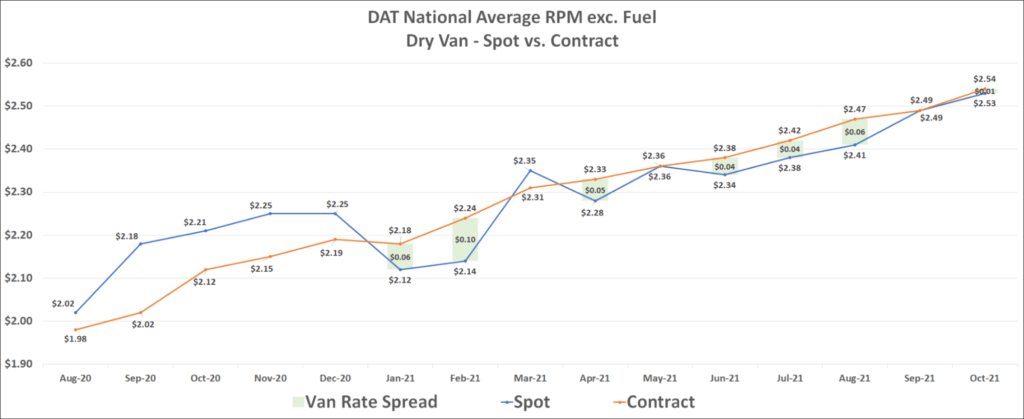
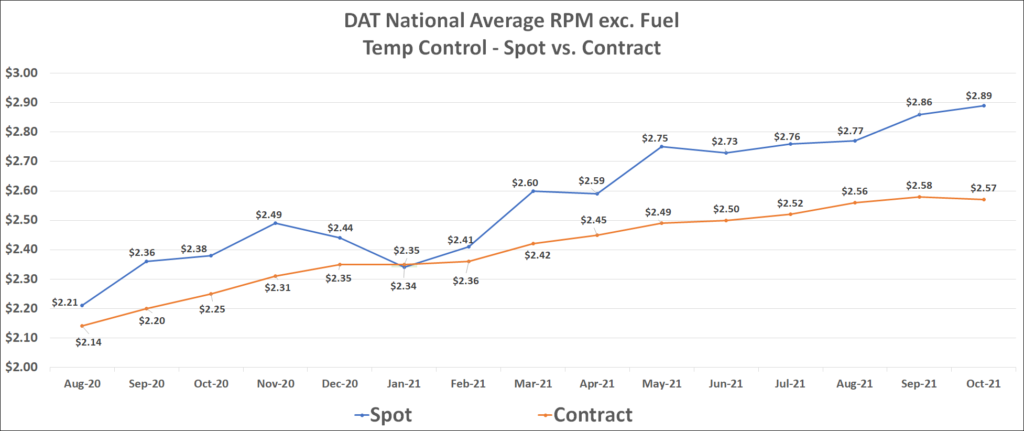
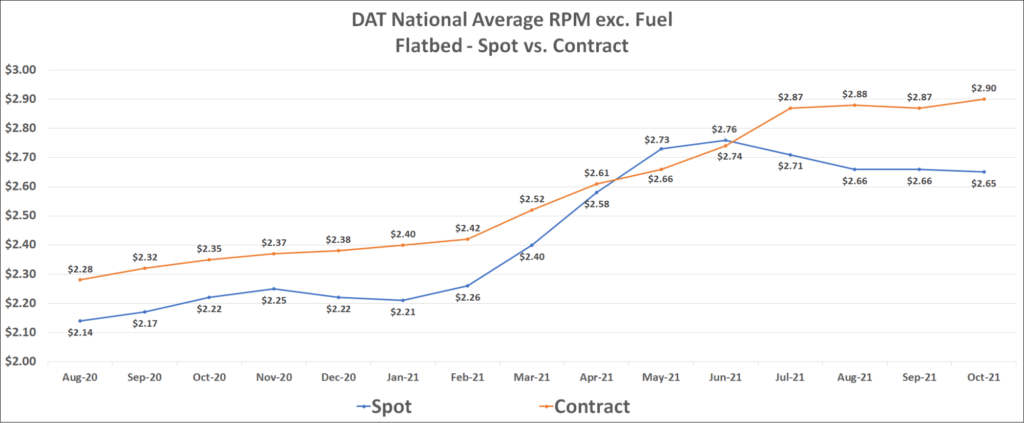
Dry van contract rates, which have not declined month-over-month since May 2020, reached a new all-time high in early October at $2.53 per mile, excluding fuel. Flatbed rates have followed suit, currently sitting at a record high of $2.90 per mile, excluding fuel, while reefer contract rates are down $0.01 so far month to date, the first decline since January.
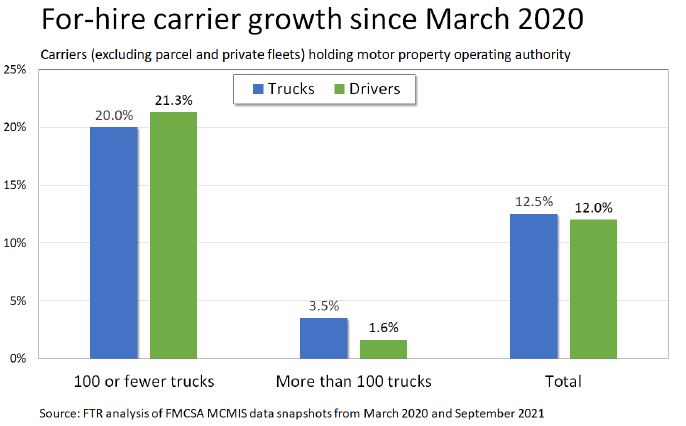
One of the trends we have seen present itself as of late is the growth in capacity on smaller fleets. Since July of 2020, the Federal Motor Carrier Safety Administration (FMCSA) has authorized more than 100,000 new for-hire carriers. These carriers comprise just 185,000 drivers. This means the average size of fleet added to the market is just 1.85 trucks, indicating a large increase in the number of smaller fleets on the road. Between March 2020 and September 2021, the number of one-truck operations holding authority has increased by 52%, and the number of carriers with two to five trucks rose by 29%. Carriers with 100+ power units have seen their total market share of trucks on the road decrease from 52% to 49%.
These trends are important because they tell the story of drivers choosing to pursue going out on their own instead of leasing their equipment and operating under the authority of a more established, larger fleet. When owner-operators go on their own, they have the flexibility to play the spot market, chasing the bigger money loads. It is difficult to quantify the extent of the impact, but we believe this trend is resulting in at least some additional upward pressure on spot rates. We also believe this trend makes capacity as a whole less available to shippers, particularly those shippers that do not work with smaller fleets, and is just another complex dynamic further complicating the freight market’s future recovery.
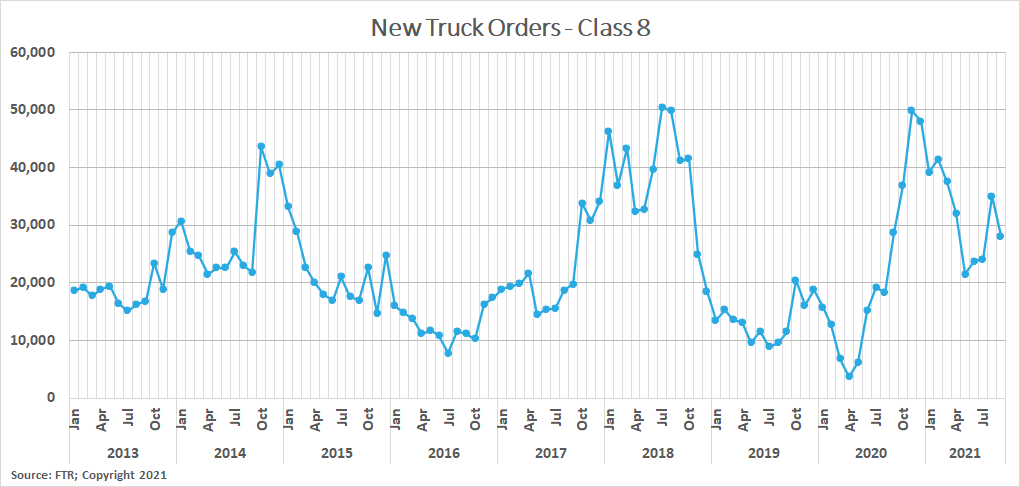
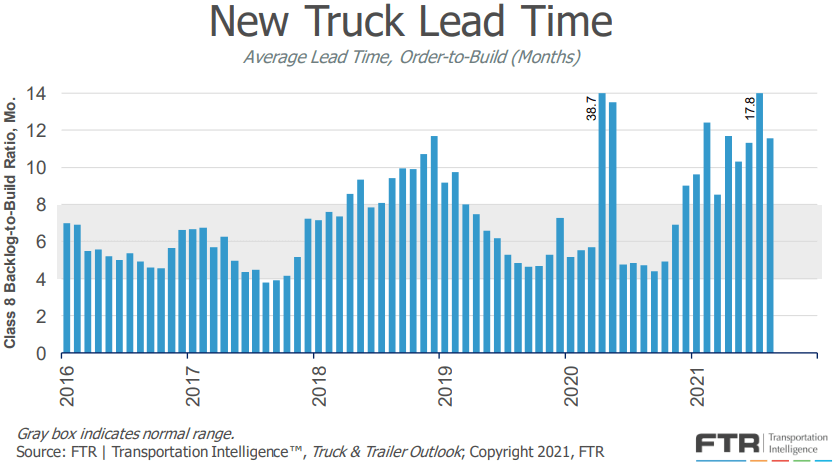
The equipment side of the equation saw some slight improvements month over month, but supply chain issues are still creating challenges for truck and trailer OEMs. Class 8 truck production in August was up 56% from July when production was highly limited due to semiconductor shortages. This helped lower the average order to delivery lead time to 11.6 months. This is a major improvement from the 17.8 months seen last month, but still represents almost a full year’s worth of backlogs for truck manufacturers to work through. New truck orders also increased in August as OEMs began booking orders for next year. New trailer production levels were unchanged in August, as OEMs produced the same number of units on a per-day basis. FTR continues to indicate that the industry is in a holding pattern until the supply chain issues impacting parts availability for truck and trailer production are resolved. In the meantime, it is going to be difficult for fleets to acquire new trucks or trailers.
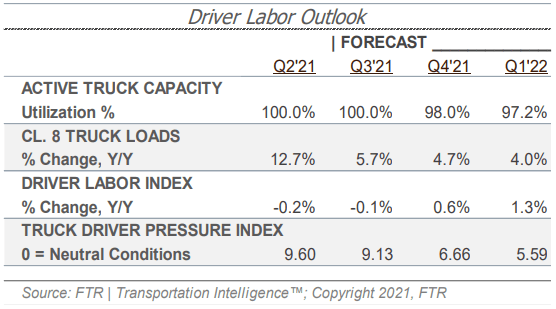
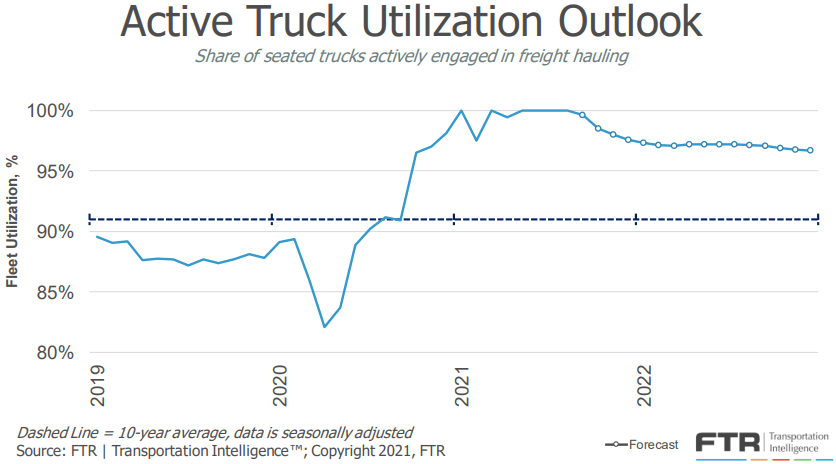
FTR’s forecast for truck utilization, the share of seated trucks actively engaged in freight hauling, remains mostly unchanged in the near term, but is now slightly stronger than in previous forecasts for the second half of next year. Utilization is expected to be above 97% through the end of next year, up from 96% last month. Overall this change is minimal when considering that the ten-year average for utilization is 91%. FTR noted that even if utilization softens relative to their expectations, they do not expect the trucking industry to see a normalization similar to what was seen after the 2018 peak. Improving driver supply indicators are a sign that most of the challenges with capacity will remain with equipment shortages, not with drivers.
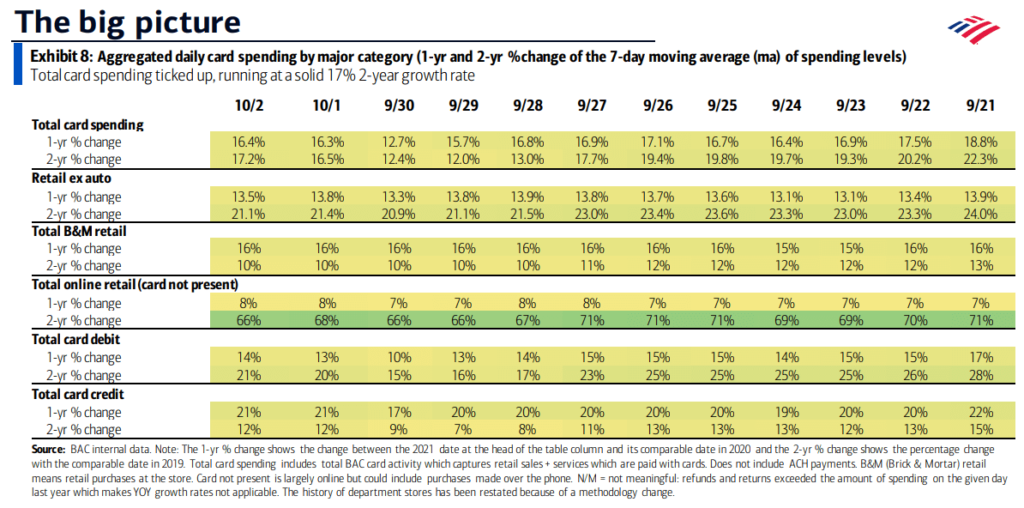
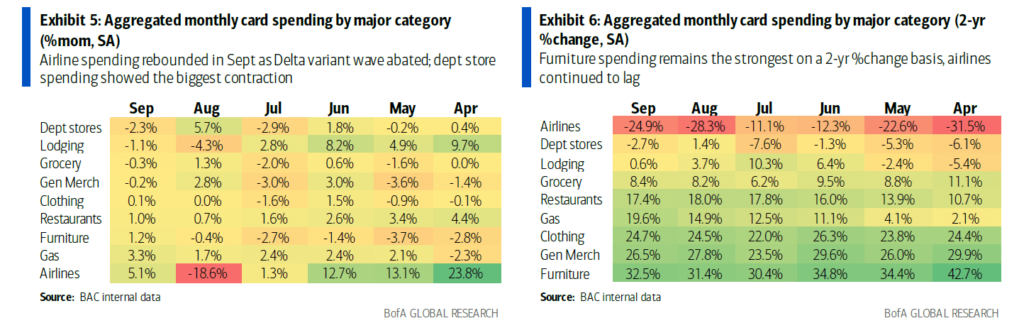
Trends BofA has specifically noted include rebounded spending on furniture and building materials, reflecting the latest increase in home sales. Airline spending has also rebounded, indicating less concern from the Delta variant. Declines in lodging spending indicate that an increase in airline spending is likely for future travel.
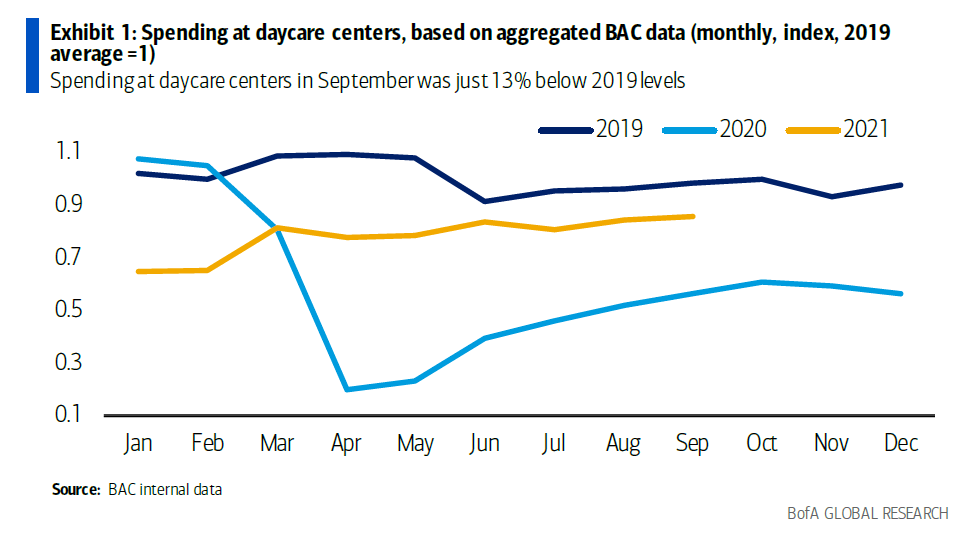
BofA also noted that spending at daycare centers in September was 52% above last year’s level and only 13% below the same time in 2019. This is an encouraging sign as reliable childcare is critical for the recovery of the labor force.
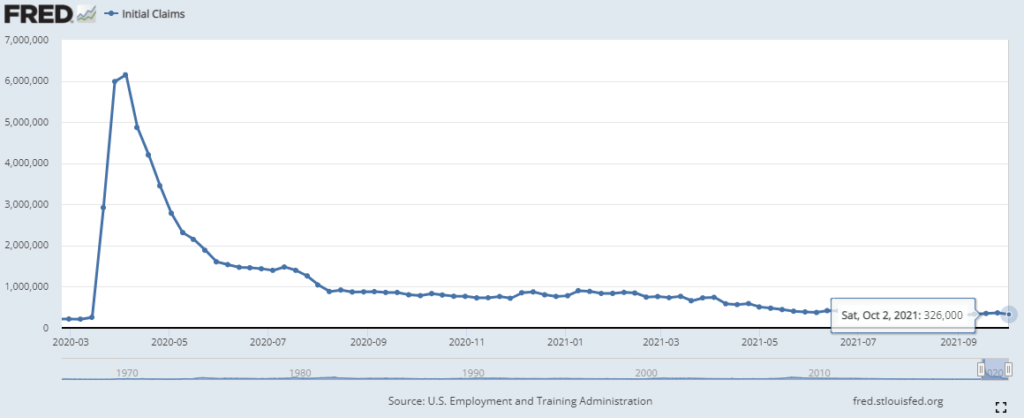
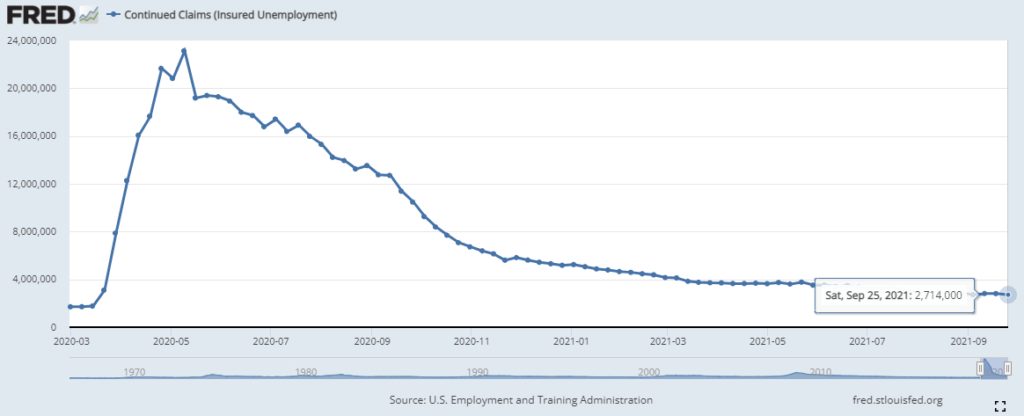
The unemployment trends have leveled off a bit in September as initial claims in the most recent week came in at 326,000, up from 310,000 from last month, but remain near the lowest totals since the start of the pandemic. Continued claims have declined further, reaching their lowest levels since the start of the pandemic, down to 2.71 million from 2.78 million last month, on a weekly basis.
"*" indicates required fields

Matt Pyatt is the Chief Executive Officer of Arrive Logistics. He co-founded Arrive with President Eric Dunigan in 2014 after building his career at Command Transportation. As CEO, he is responsible for overseeing the company’s financial health, strategic vision and culture, as well as building a scalable leadership team to support Arrive’s growth.
"*" indicates required fields
"*" indicates required fields
Please have the following info ready to complete registration
Fraud Prevention
Freight fraud continues to impact our industry. We encourage shippers and carriers to reach out to Arrive immediately if there is ever a shipment in question that may be subject to fraud (including fictitious actors and websites). Arrive will not ask you to pay upfront for any dedicated lane or committed capacity program. If the offer you are receiving sounds too good to be true or unrealistic, it may be fraud. Arrive Logistics recommends verifying all communications come from our registered email domain is @arrivelogistics.com and notes that access via VPN or Proxy is prohibited on Arrive systems. Our 24/7 phone number is 888-861-0650 and our leadership team can also be reached at feedback@arrivelogistics.
Use of Cookies
We use cookies to enhance your browsing experience, serve personalized ads or content, and analyze site traffic. By continuing to use this website, you acknowledge and consent to our use of cookies as detailed in our privacy policy.
If you’re not an Arrive customer, please join our network to access the portal.
"*" indicates required fields

Scott Sandager is the Chief Administrative Officer at Arrive Logistics. He joined Arrive in 2018, bringing over 14 years of logistics and brokerage experience, with expertise in project and change management, organizational design, talent development and customer satisfaction. Scott previously held many diverse roles of increasing responsibility with AFN, a Chicago-based freight brokerage.

Eric Dunigan is the President of Arrive Logistics. He began his career at Command Transportation before co-founding Arrive with Matt Pyatt in 2014. As president, he is responsible for driving revenue and growth, as well as leading the Strategic Partnerships team — a veteran group of supply chain experts who work with Arrive’s customers to reimagine their shipping strategy.
"*" indicates required fields

David Spencer is the Vice President of Market Intelligence at Arrive Logistics. David joined Arrive in 2017 after spending six years at AFN focused on business intelligence. His department provides critical market data and expert analysis to internal teams and publishes monthly market updates for shippers and carriers under the Arrive Insights banner.

Andrew Clarke is Board Chairman for Global Critical and DCLI, Inc., and a board member for Arrive Logistics and Element Fleet Management Corp. His 20 years of global transportation and logistics experience include time as CFO of C.H. Robinson, CEO of Panther Expedited Services, Inc. and SVP and CFO roles at Forward Air Corporation.

Dean Croke is a Market Analyst at DAT Solutions, where he focuses on freight market intelligence and data analytics. His 35 years of experience with data analytics, transportation, supply chain management, mining and insurance risk management include time as co-founder of FleetRisk Advisors and in a number of other high-level roles with FreightWaves, Spireon, Lancer Insurance, Omnitracs Analytics (formerly Qualcomm) and more.

Asanka Jayasuriya is the CTO at 8VC. He is an accomplished engineering and product leader with 20+ years of experience in the cloud. He has a strong background in enterprise SaaS, PLG products, infrastructure, and security. Notably, he served as CTO and SVP of Engineering at SailPoint, leading their successful transition to the cloud and successful exit event. He also held senior leadership roles at InVision, Atlassian, and Amazon, driving growth, operational excellence, and innovation. At 8VC, Asanka works with the entrepreneurs and leaders in our portfolio as a virtual CTO supporting their growth.

Chad Eichelberger is the President of Reliance Partners. Since 2015, he’s leveraged his extensive experience in risk management, compliance, best practices and contracts to lead the company’s logistics and truck insurance strategy and operations. Chad was previously the President of Access America Transport, where he led the company from $8M to over $600M in revenue.

Barry Conlon is the CEO and founder of Overhaul, the global leader in active supply chain risk management and intelligence. With a remarkable career spanning over 30 years in supply chain security, he is widely regarded as a trailblazer in modern-day supply chain security standards and best practices.

As VP and Senior Analyst at ACT Research, Tim analyzes commercial vehicle demand and alternative powertrain development (i.e. electrification), and authors the ACT Freight Forecast, U.S. Rate and Volume Outlook. He previously spent fifteen years in equity research focused primarily on the transportation, machinery, and automotive industries, and co-founded leading equity research firm Wolfe Research.
"*" indicates required fields