

The FreightWaves SONAR Outbound Tender Volume Index (OTVI), which measures contract tender volumes across all modes, was down 26% year-over-year as of October 1st.
Of course, it is important to note that OTVI includes both accepted and rejected load tenders, so we must discount the index by the corresponding Outbound Tender Rejection Index (OTRI) to uncover the true measure of accepted tender volumes. The downward tender volume trend dropped to 10.6% below last October when applying this method to year-over-year OTVI values. The adjusted month-over-month index was down 3.4% from early September, indicating declines in contract volumes from a month ago.
Tender rejections are down 75%, from 21.7% a year ago to 5.3%, which helps explain the lower negative year-over-year growth trend in accepted tender volumes compared to the decline in total tender volumes.
As for specific equipment types, the dry van tender volume index was down 25%, and the reefer tender volume index was down by 31%, equating to a 9.2% year-over-year decrease for actual van volumes and a 4.8% increase in actual reefer volumes. Dry van tender rejections are down by 76% year-over-year. For reefer equipment, that number is more than 81%.
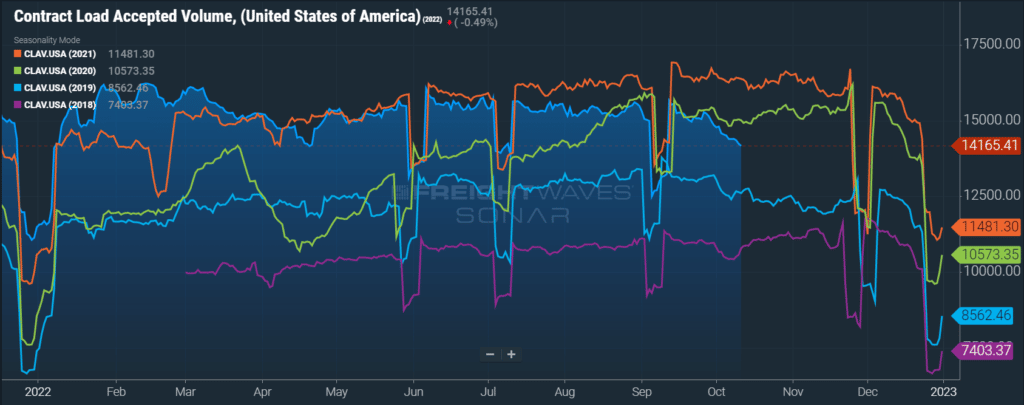 Accepted contract volumes are down 10.6% y/y in early October but remain above historical pre-pandemic levels.
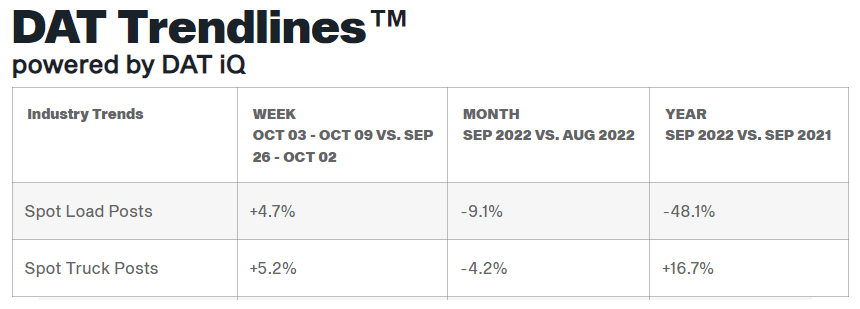
In recent months, spot market demand has suffered as shippers continue to experience strong routing guide compliance. DAT data indicates that year-over-year spot volumes were down by 48% in September after falling 9.1% month-over-month from August.
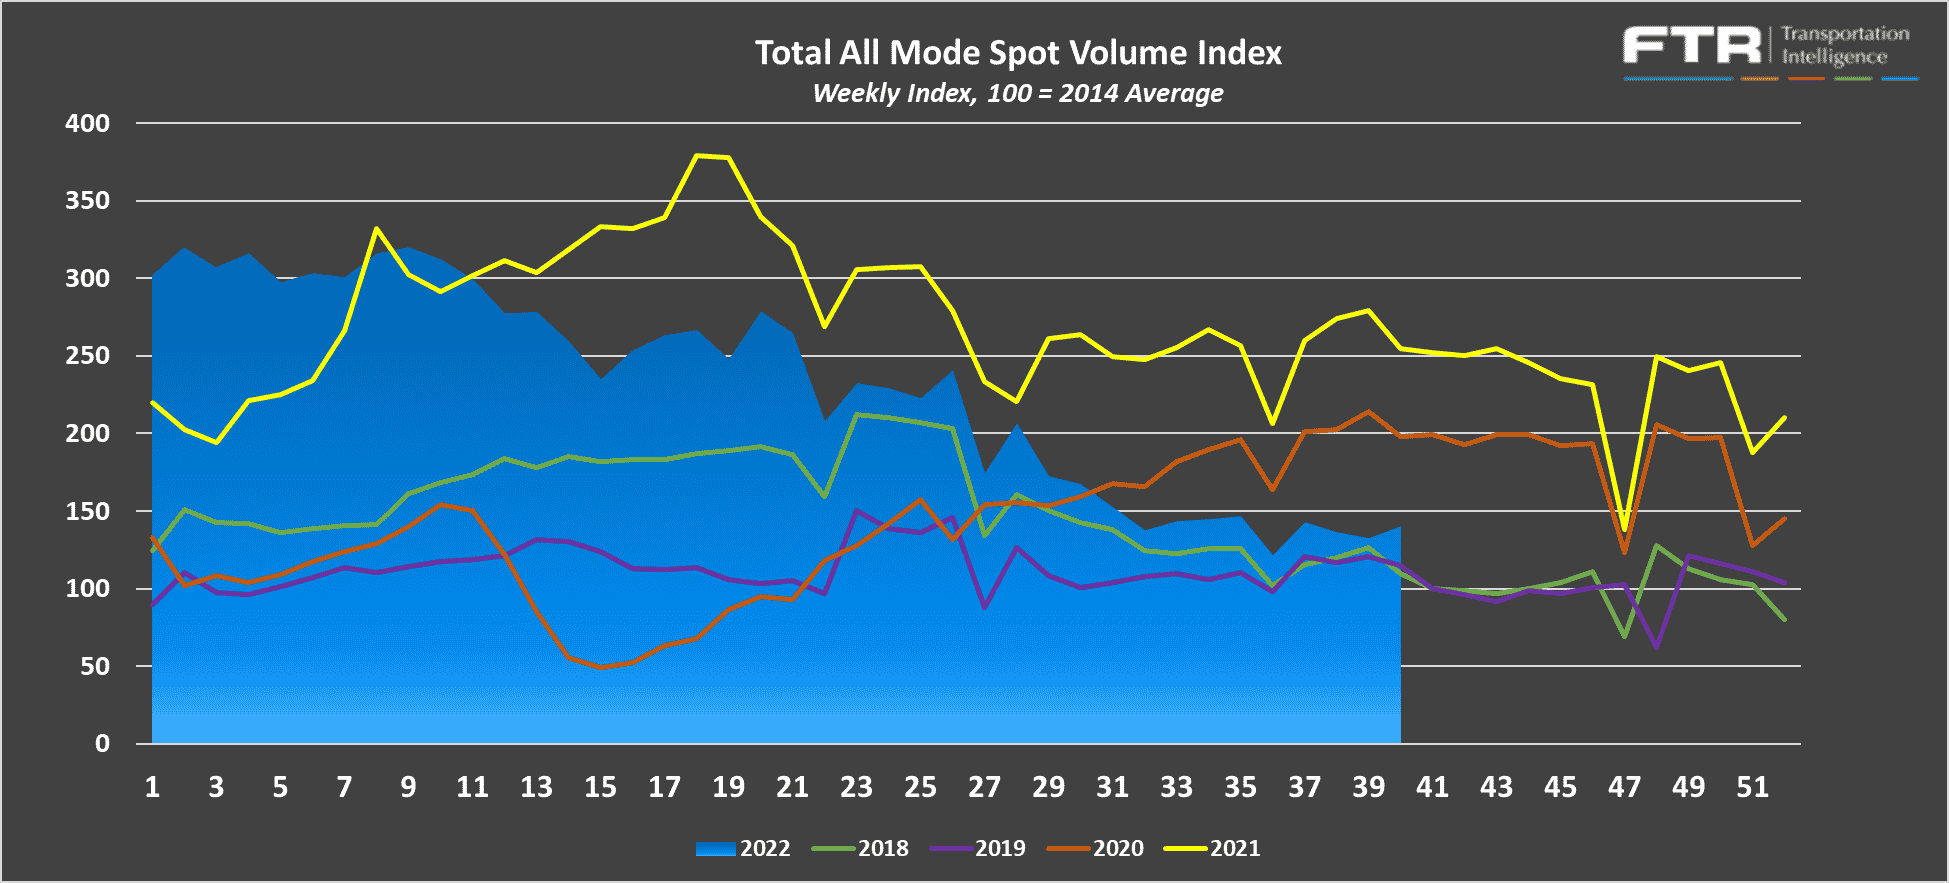
FTR and Truckstop’s Total All Mode Spot Volume Index helps illustrate that even though spot volumes are down from last year, they remain in line with pre-pandemic levels. The All Mode Index is now down 45% year-over-year but remains up 22% from 2019, a sign of relative strength compared to historical norms.
Truckload Supply has shown signs of increasing stability over the past month. All indicators point to slight sequential capacity improvements and vast year-over-year improvements. That means while conditions in early October remain relatively similar to September and August, capacity is significantly better than a year ago.
The Sonar Outbound Tender Reject Index (OTRI) measures the rate at which carriers reject the freight they are contractually required to take. The current rate is 5.05%, which indicates shippers are seeing extremely high routing guide compliance on their contractual freight, matching expectations coming into the month.
Over the past few weeks, rejection rates have been very similar to seasonal 2019 levels. They reached the lowest point seen this time of year since the metric’s creation in 2018, as moderating demand trends and the gap between spot and contract rates contributed to declining tender rejections throughout the month.
Typical seasonal trends would point to easing pressures between now and mid-November, when seasonal demand ramps up in the weeks leading up to Thanksgiving. At that point, a sizable jump is possible but unlikely, given the stability we have seen with routing guides in recent seasonal demand surges.
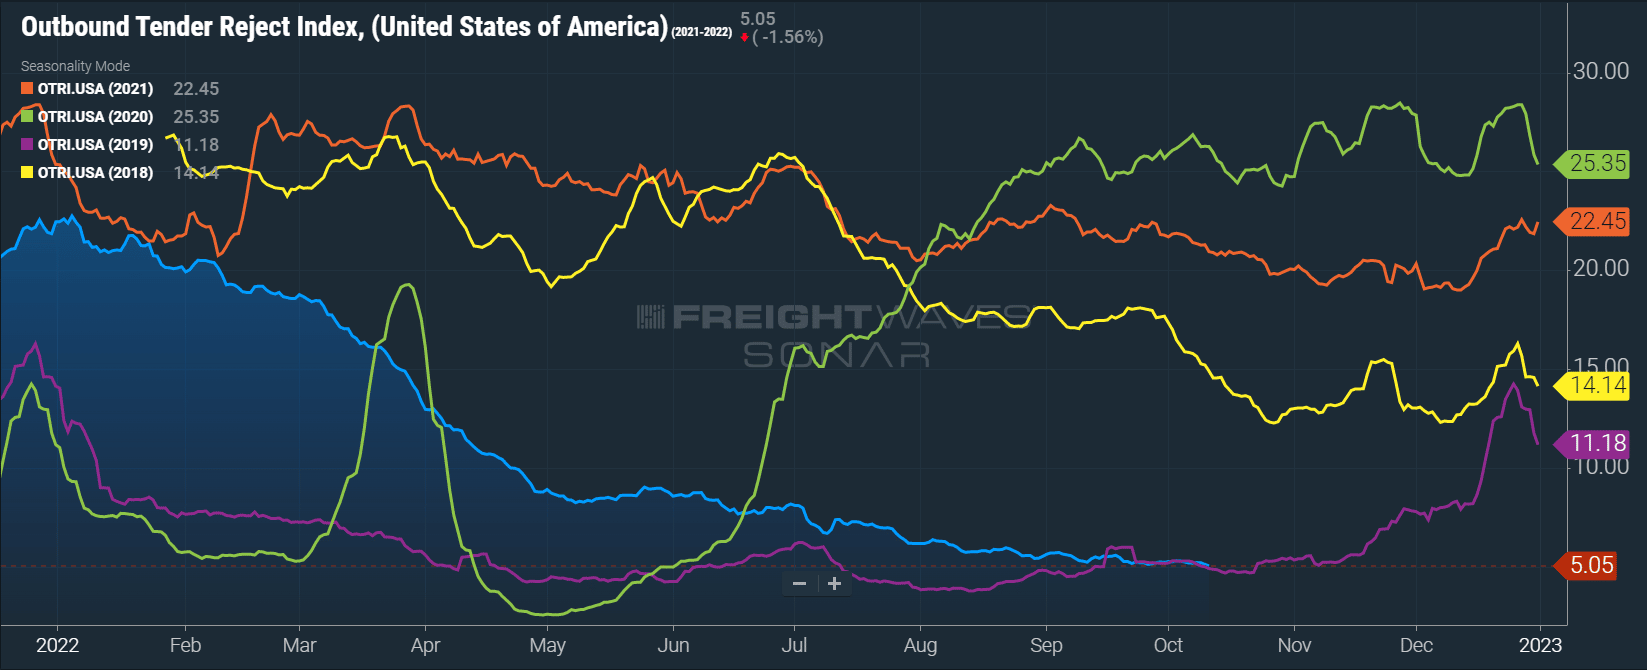 OTRI continued its gradual decline to equilibrium levels throughout September and early October, falling to 5.05%.
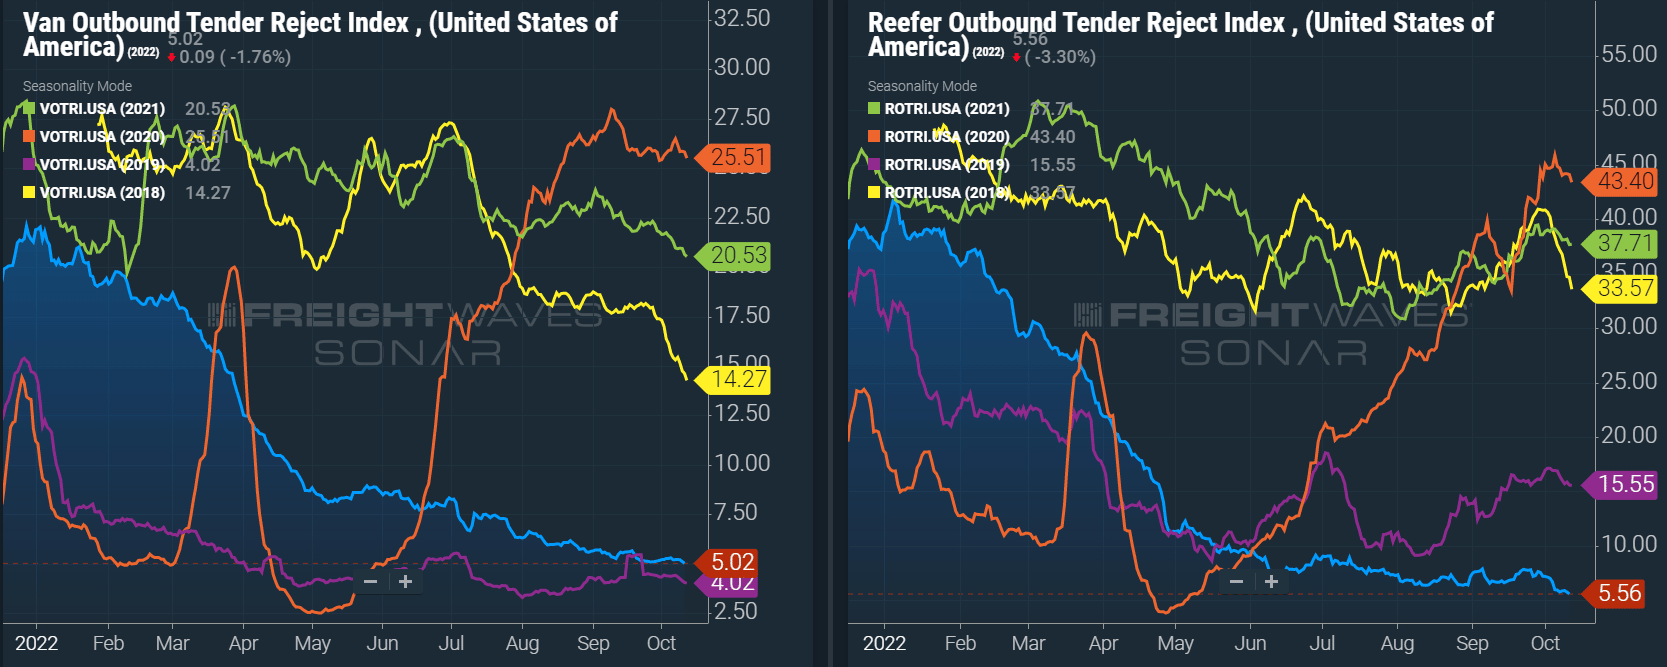 Dry van tender rejections followed a similar trend to the all mode index, normalizing in September and early October, but reefer rejections saw volatility before settling in recent weeks.
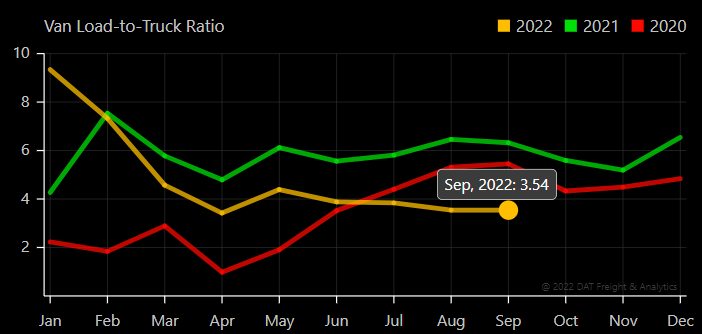
The DAT Load to Truck Ratio measures the total number of loads compared to the total number of trucks posted on their spot load board. In September, the Dry Van Load to Truck Ratio was flat month-over-month at 3.54 loads per truck and down 43.9% year-over-year. As previously noted, a ratio in the 3-4 range is typical of equilibrium market conditions where supply is sufficient to meet demand.
The Reefer Load to Truck Ratio fell to 6.33, down 10.6% month-over-month and 53.2% year-over-year.
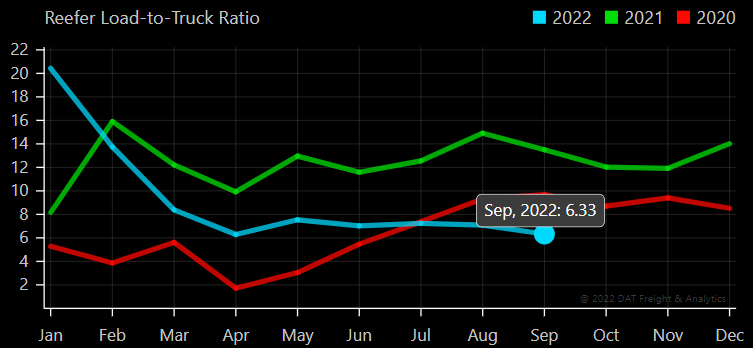
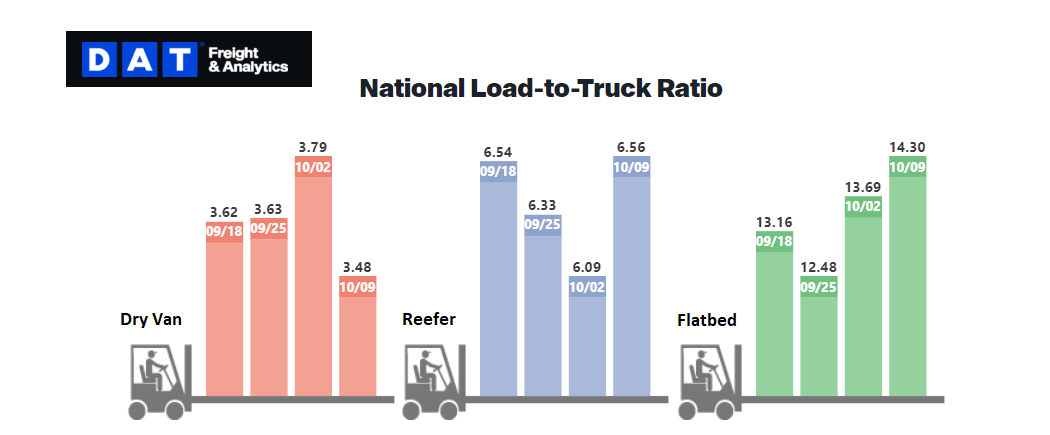
Weekly load-to-truck ratios for van and reefer equipment have shown some volatility in recent weeks, but overall conditions remain stable. In the flatbed sector, we have seen back-to-back weeks with increasing tightness following Hurricane Ian’s landfall in Florida. Flatbed is the equipment most in demand to support the relief effort; it would not be surprising to see continued volatility with this equipment in the coming weeks, especially in the Southeast region.
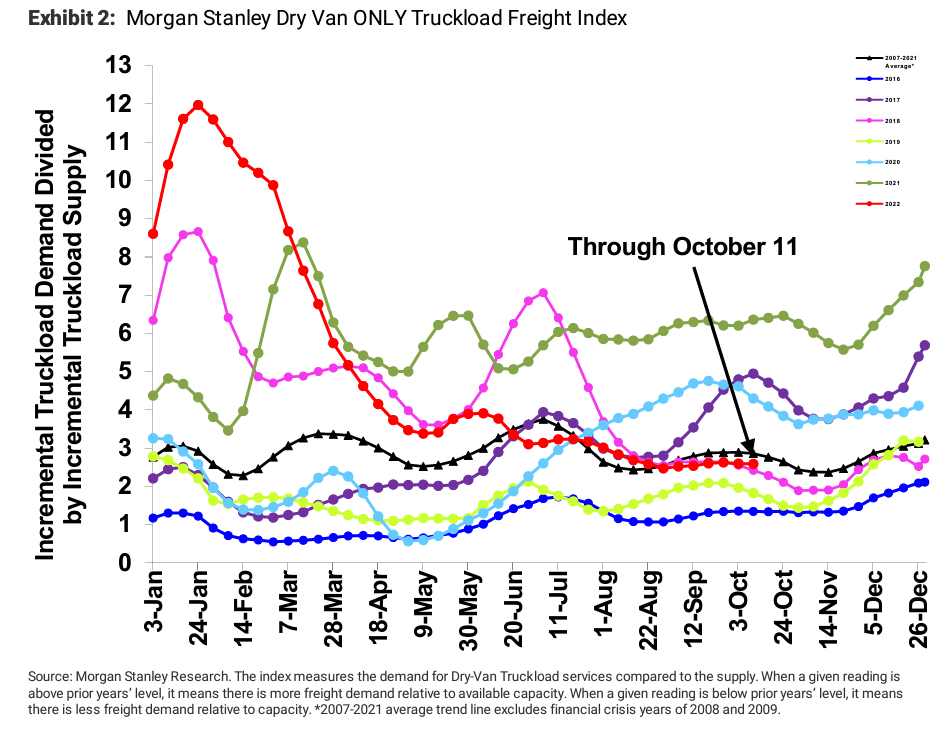
The Morgan Stanley Dry Van Freight Index is another measure of relative supply. The higher the index, the tighter the market conditions.
Data from September showed relatively stable capacity conditions, mostly underperforming the slight increase in tightness seen with historical seasonality in the month. The black line with triangle markers on the chart provides a great view of what directional trends would be in line with normal seasonality based on historical data dating back to 2007. This data supports our outlook for minimal chances for increasing volatility throughout October.
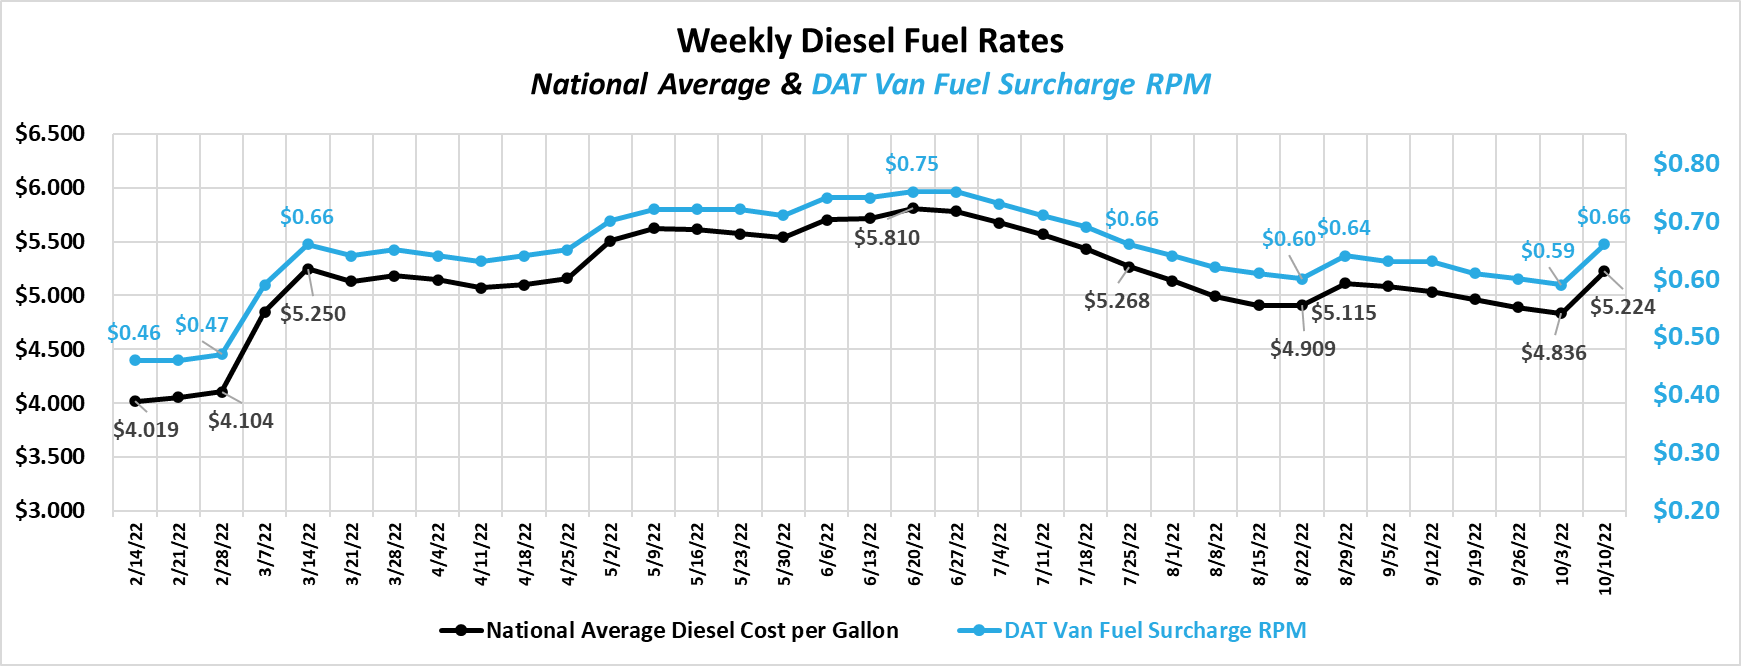
After five straight weeks of declines to the lowest prices seen since February, the national average price per gallon of diesel surged in early October following an announcement of planned production cuts from OPEC. With rapid fuel costs increases, we expect to see a decline in the spot linehaul rate per mile as the fuel portion of the rate to a carrier increases. Spot rates are typically negotiated as an all-in rate with fuel included, making it more difficult for carriers to see rate increases that offset the rising fuel expense entirely. Elevated prices are deflationary on the freight market in multiple ways. As long as they remain elevated, shippers will continue to look for cost savings in other areas, leading to further downward pressure on linehaul rates. Further, consumers will spend less on goods to offset increases in their gas spending, leading to downward pressure on truckload demand if sustained.
When looking at trends for all-in spot rates, including linehaul and fuel costs, we caution reading too much into the October data, as we expect this week’s increase in fuel costs and easing pressures throughout the month to drive down rates. This month, however, rates have been trending down across all three equipment types.
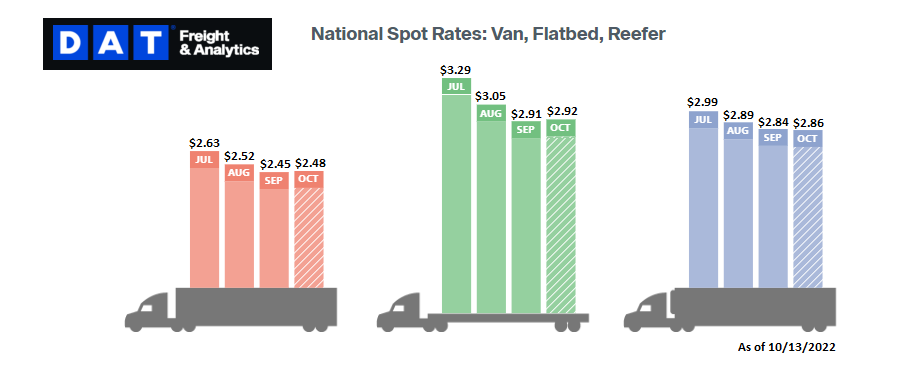
While spot rates have shown some strength in early October, propped up by carryover from Hurricane Ian and the end-of-quarter push in late September, contract rates are still experiencing downward pressures due to the large gap between the two. Over the past few months spot rates have moved more in line with normal seasonal expectations, indicating that there may not be much more room for spot rates to fall, especially considering the increases in operating costs carriers have experienced over the past few years. On the contract side, however, we expect downward pressure on rates to continue as long as the gap between the two persists.
The current dry van contract rate is $2.44 per mile, excluding fuel — a decrease of 2.8% from $2.48 per mile in September 2021. Although linehaul rates are down by 6.5% year-over-year, all-in rates remain up by 6.2% due to increases in fuel costs. We have seen a 7% decline from the peak of contract rates, excluding fuel, in February, with no signs the floor has been reached.
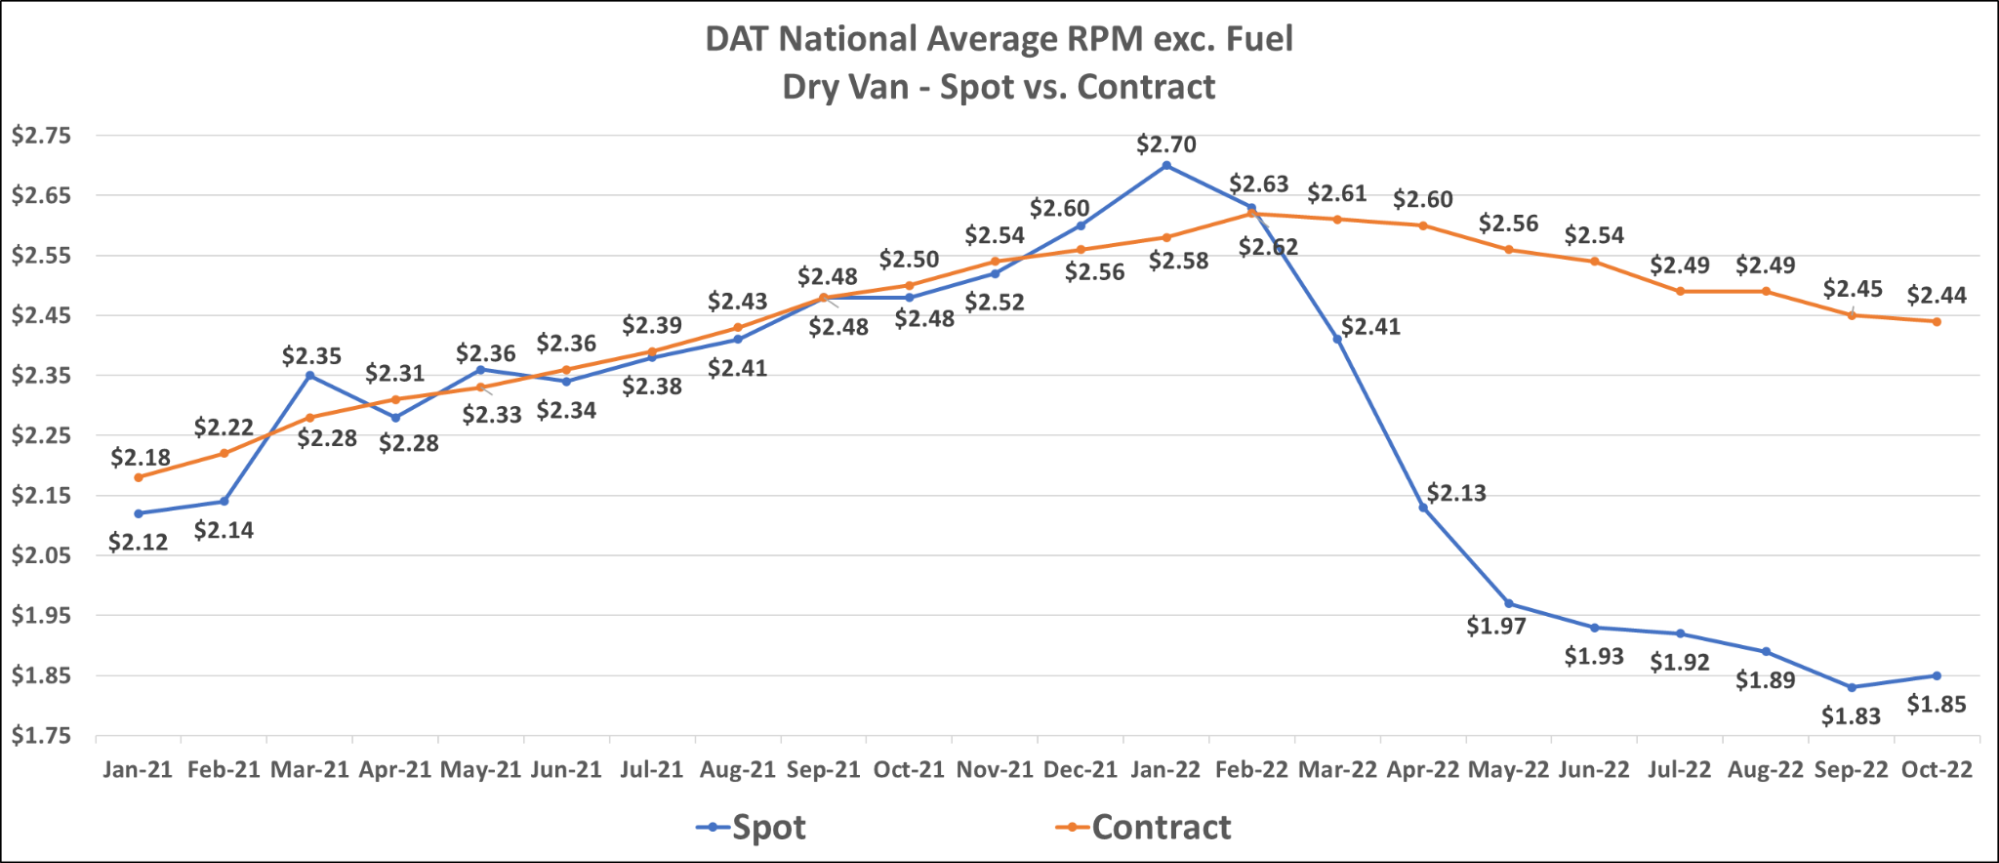 Dry Van spot and contract rates have trended up into early October but are expected to dip as the month progresses.
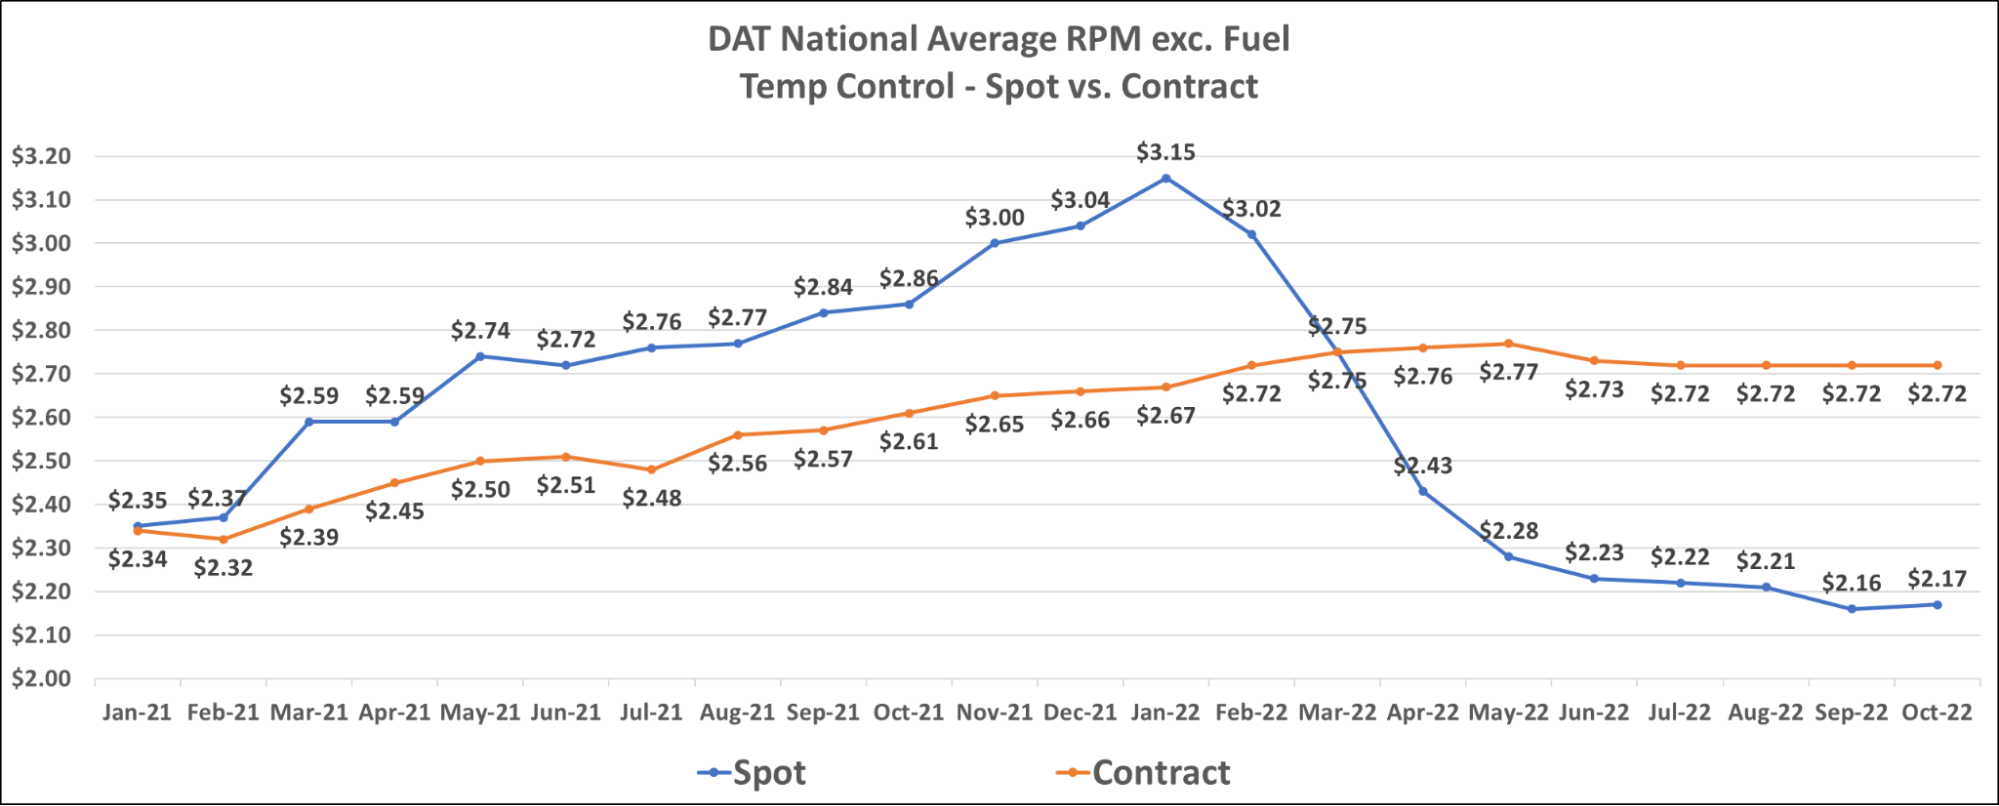
Reefer spot and contract rates have followed a very similar trend to van rates, with relatively flat contract rates and spot rates showing some strength early in the month. The current reefer contract rate is $2.72 per mile, excluding fuel, for the fourth straight month. The current reefer spot rate is $2.17 per mile, excluding fuel. A decrease of 24% from $2.86 per mile in October 2021. Contract rates remain up 4.2% from $2.61 per mile, excluding fuel, over the same period.
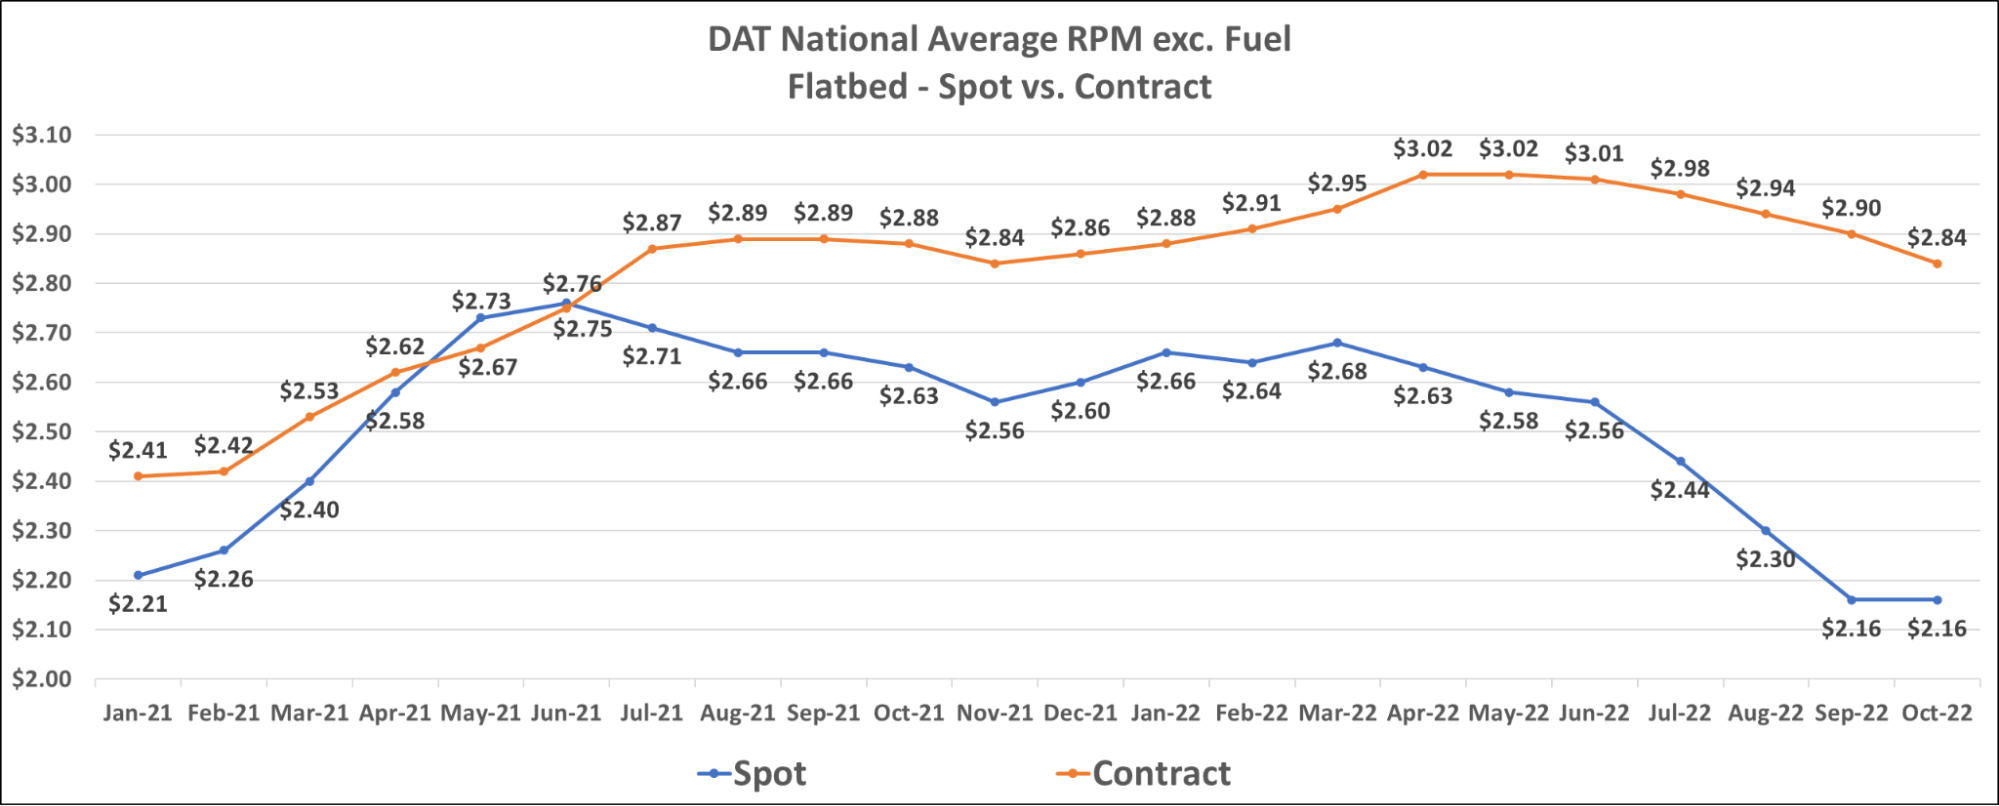
The flatbed market is seeing spot rates increase after several months of continued declines. The current flatbed spot rate is $2.16 per mile, excluding fuel. A decrease of 18% from $2.63 per mile in October 2021. Flatbed contract rates are still declining, with the current flatbed contract rate at $2.84 per mile, excluding fuel. The decrease of $0.06 month-over-month now puts flatbed contract rates into negative year-over-year growth territory, down 1.4% from $2.88 per mile, excluding fuel, in October 2021.
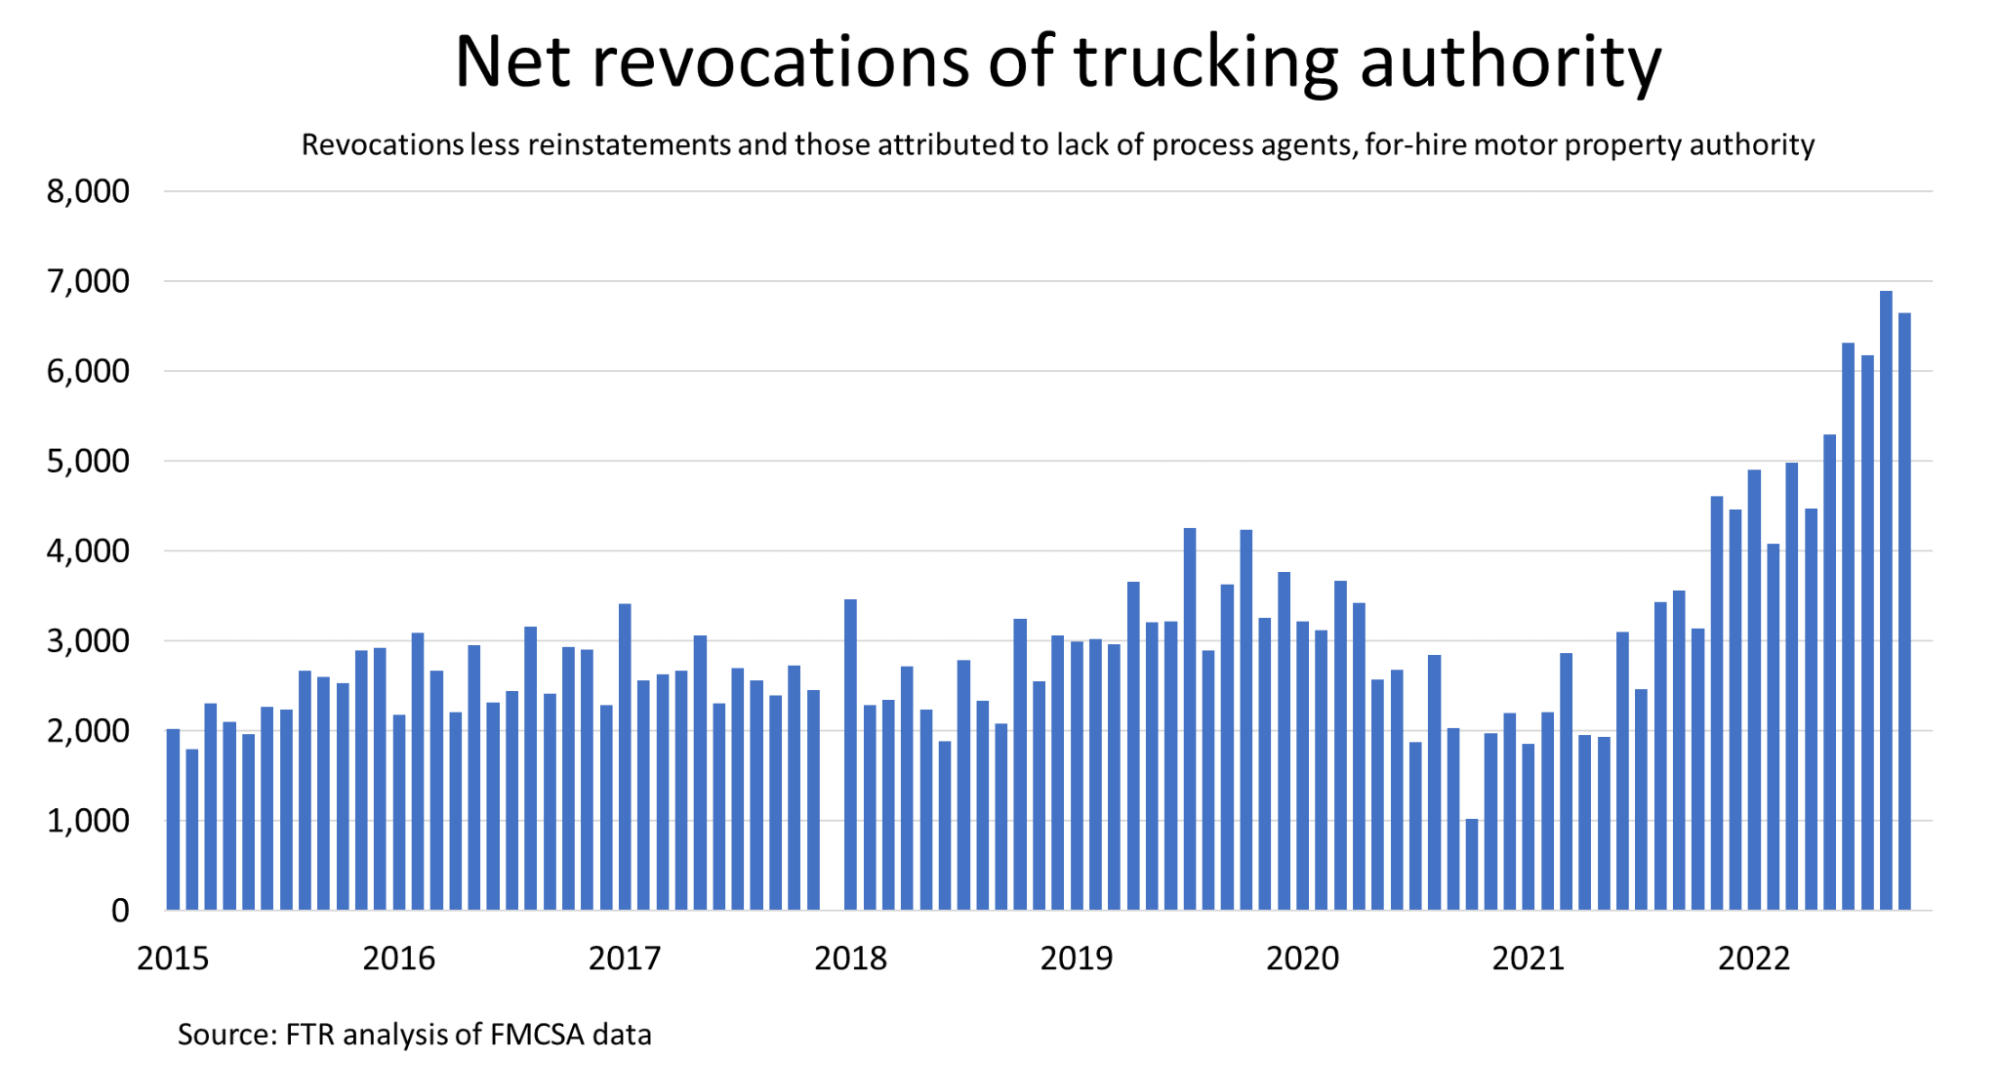
September capacity conditions were mostly consistent with recent month-over-month reports. Fewer carriers are entering the market, while record numbers are giving up operating authority. This is no surprise considering operating costs remain higher than ever, and spot rates are seeing significant declines. As calculated by the FTR, net revocations of trucking authority reached an all-time high in August, excluding revocations associated with a lack of a designated process agent. Elevated revocations of authority are expected to continue if current trucking conditions persist.
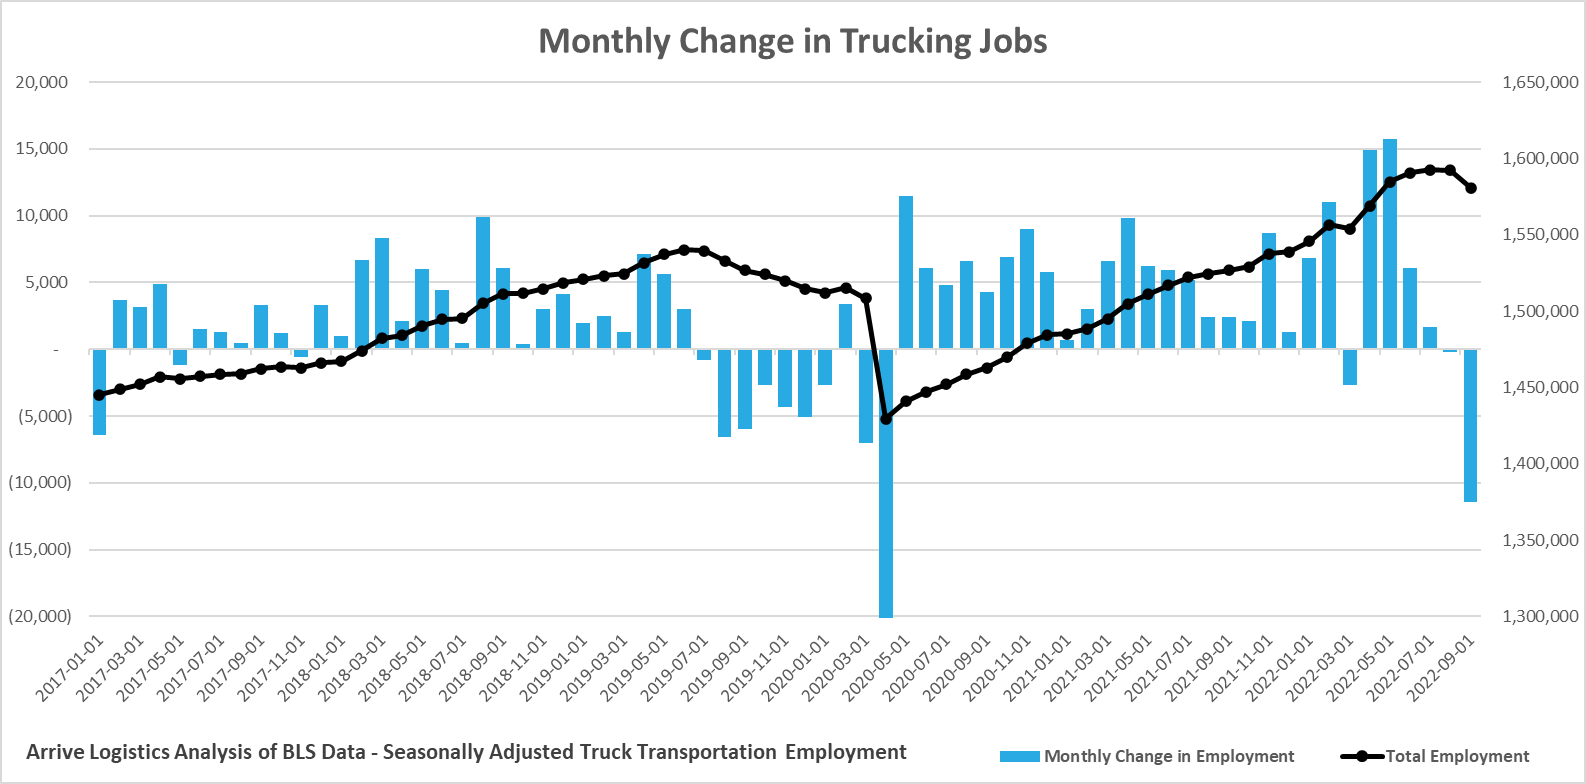
Despite the rise in trucking authority revocations, the period from February to July saw strong trucking job growth. Our interpretation is that owner-operators and drivers were shutting down in favor of taking company jobs. Aside from the early days of the pandemic, September job growth slumped to the lowest level since the 2009 recession. Total employment increased to a new all-time high in August, but, as anticipated, total employment is now on the decline.
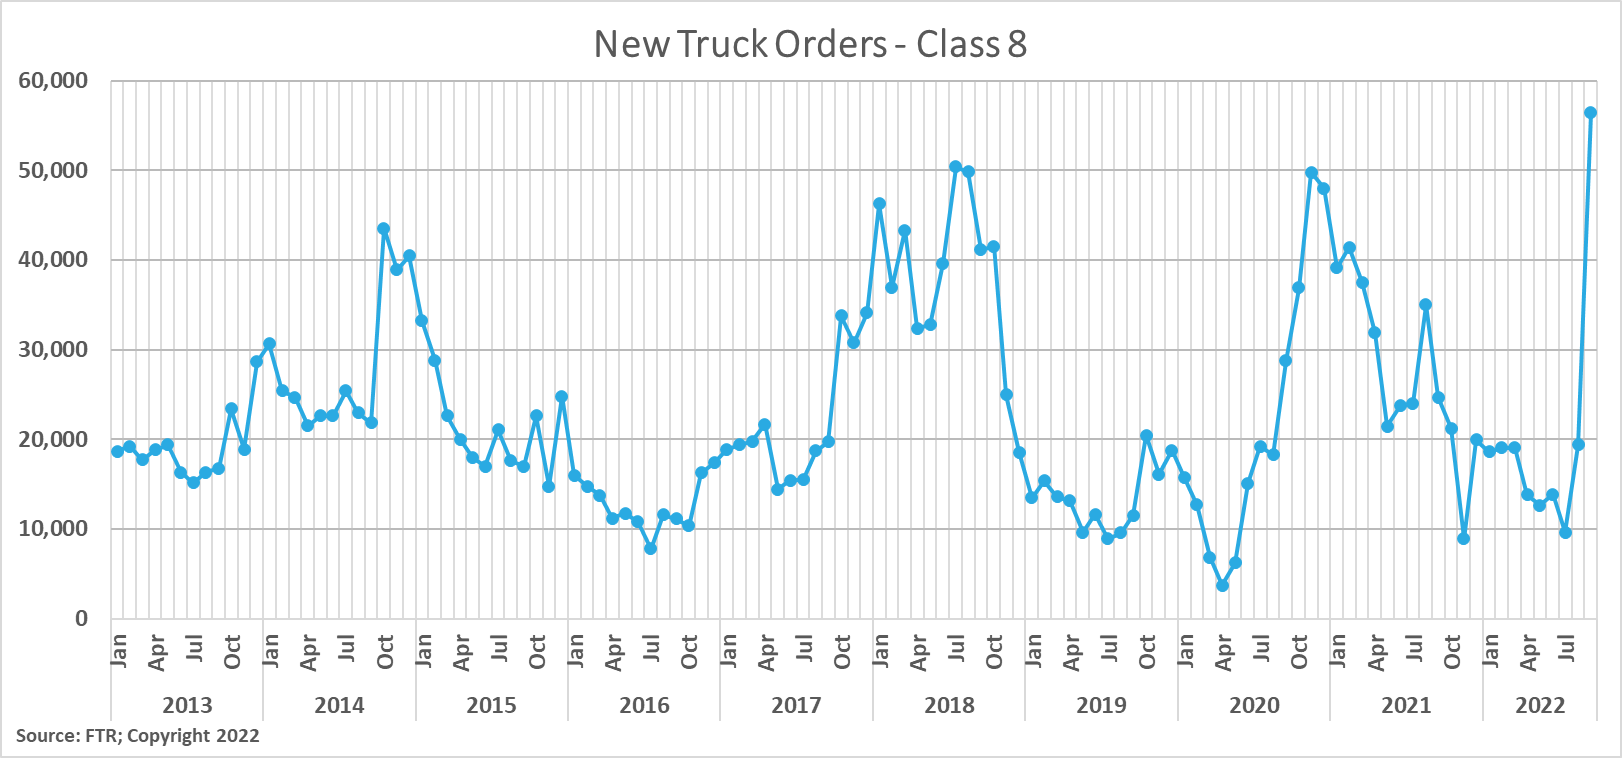
According to FTR, New Class 8 truck orders experienced a significant uptick from 21,400 units in August to more than 56,000 units in September. It is important to note that OEM’s are controlling order levels to prevent backlogs from getting out of hand. From this perspective, we do not consider new truck orders to be a strong indicator of carrier sentiment about future demand, as strong orders will be required to replace aging equipment alone. Before the large increase in orders, production productivity growth reduced the average time from order to delivery from 8.8 to 6.9 months.
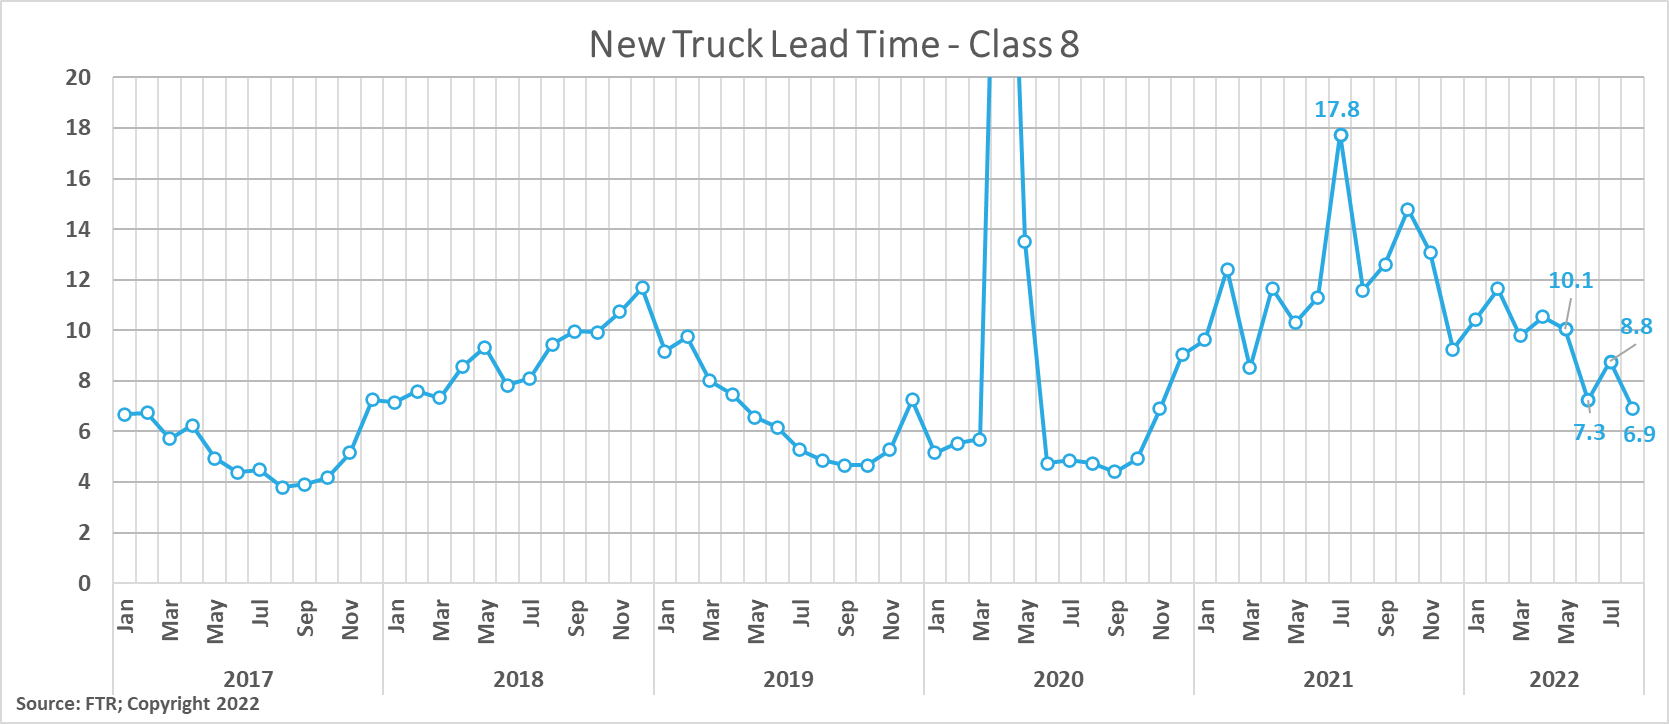 New truck lead time decreased from 8.8 months in July to 6.9 months in August.
Trailers are in high demand, but OEMs are limiting orders for 2023 due to supply chain constraints. Shippers in Arrive’s network continue to note the value drop trailers have provided in creating efficiencies at warehouses amid labor challenges and providing excess warehouse capacity to those with overstocked inventories. The ability to plan has limited unnecessary dwell times and detention payments to carriers. Additionally, carriers find efficiency gains in drop trailers, getting increased asset utilization on tractors when limited time is spent waiting for loads to be loaded or unloaded. We expect this trend to continue throughout at least the remainder of the year as retail inventories remain elevated.
Normalization continues to be a theme when looking at indicators of future truckload demand. Several factors working against future demand, such as high inflation and the FED increasing interest rates, will eventually lead to declining volumes. However, we are not seeing nor do we ultimately expect to see volumes fall off a cliff — it’s more likely that the pullback will remain gradual.
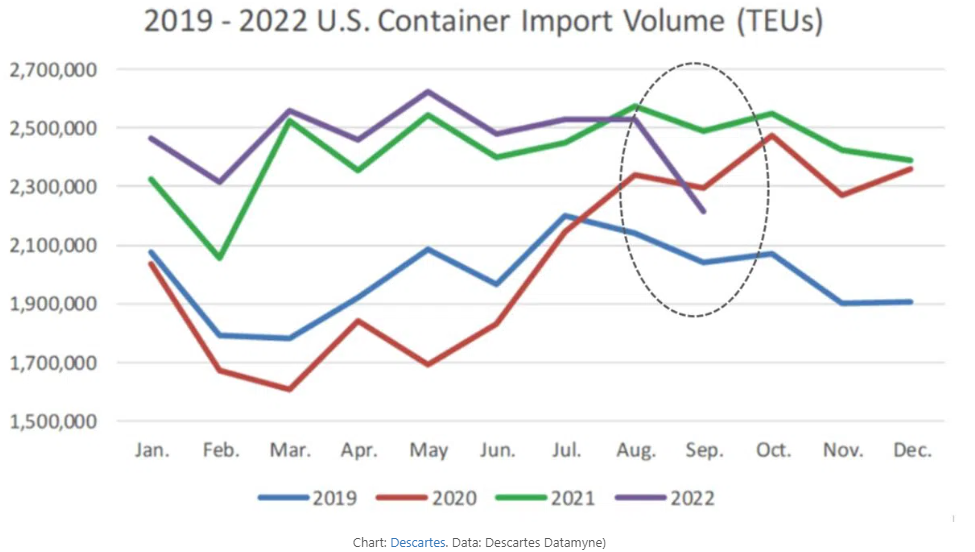
We look to import volumes as a key contributor to overall truckload demand, so understanding these trends is critical to our demand forecast. Depending on your source for import volume data, you might be hearing a different story about September year-over-year trends. Still, both Descartes and PIERS data point to significant month-over-month declines compared to August, some of which are related to slowdowns in Savanna from the impact of Hurricane Ian. However, we’re still seeing relative strength vs. 2019 levels.
Similar to over the road trucking volumes, it is no surprise that while we are seeing some momentum from the past few years reverse course, overall levels remain historically elevated. For context, Descartes data indicated September 2022 imports were down 11% vs. September 2021 and 12.4% from August 2022. PIERS data only shows a 0.8% year-over-year decline in September but an 8% decline month-over-month from August.
FreightWaves reports that 103 container ships were waiting offshore of North American ports as of late September, most of which were located at East and Gulf Coast ports where average unloading wait times remained at over ten days.
Trends similar to past months are playing out in industrial production, manufacturing and housing. IP and manufacturing maintained strength, while the housing sector continued to slow down quickly.
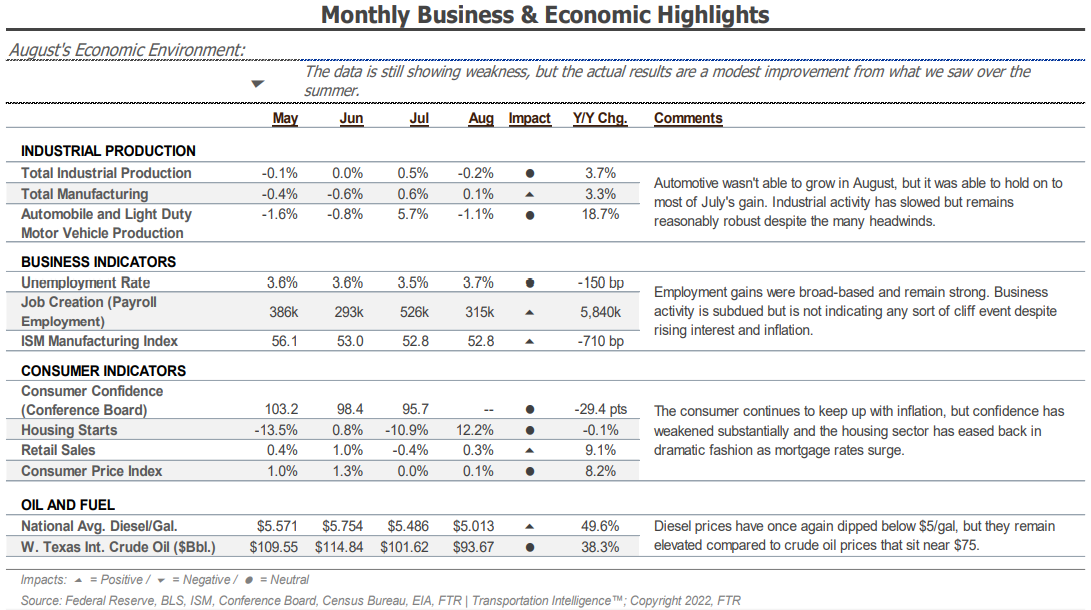
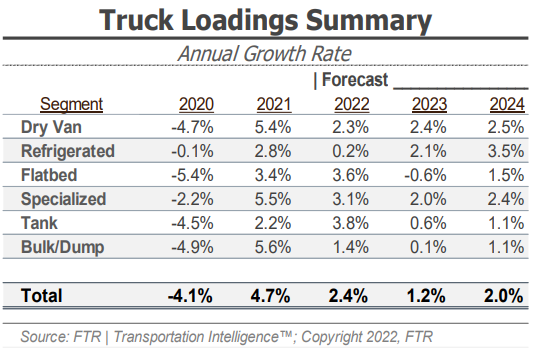
According to the prior forecast, FTR’s latest truck loadings forecast of a 2.4% year-over-year increase in 2022 is down from 2.9%. The 2023 forecast has been revised to 1.2% growth from 2.0% as of the last update.
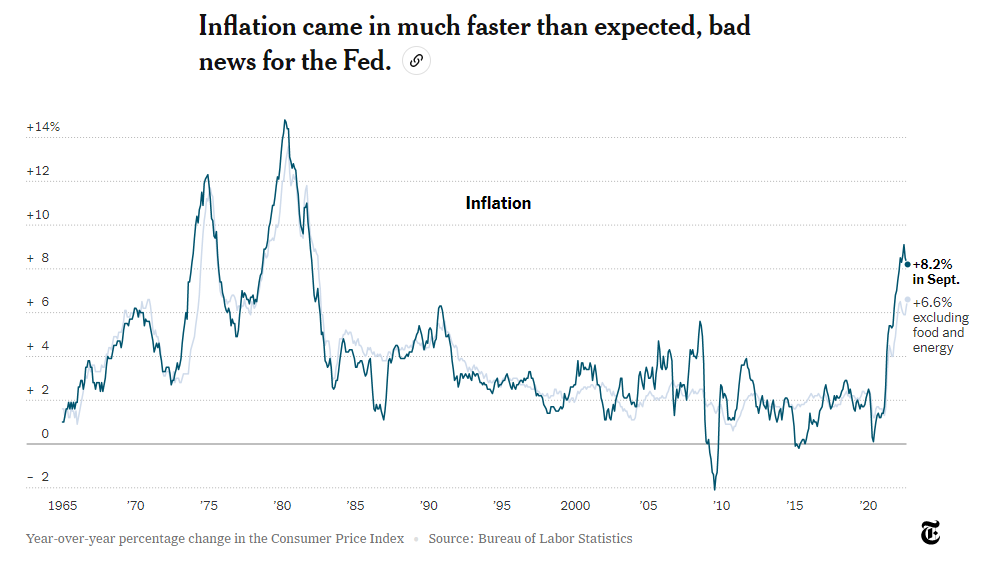
CPI data released in early October shows inflation was higher than expected in September, falling from 8.3% to 8.2% year-over-year growth (6.6% when excluding food and energy). Falling gasoline prices can explain this slight dip. Month-over-month, overall inflation climbed by 0.4% — 0.6% when excluding food and energy — leading analysts to expect another interest rate hike in November.
Consumer spending trends remained relatively stable overall, but goods spending growth was negative across most categories in September.
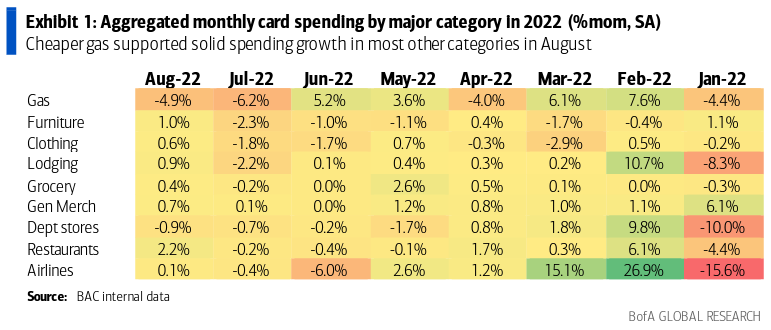
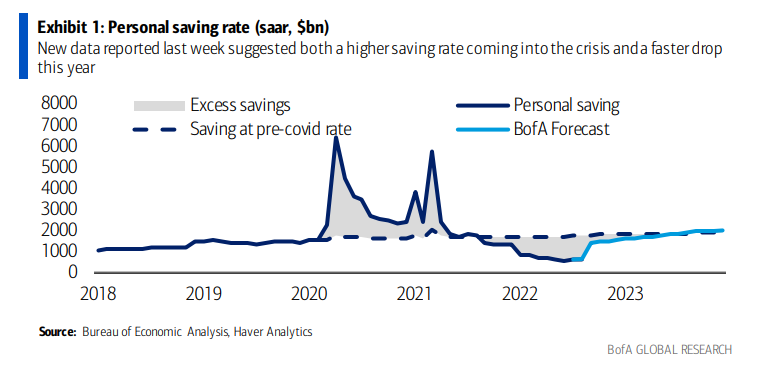
Even though consumers still have higher savings and potential spending power, this “nest egg” may be dwindling for many. Some experts believe consumers are holding surplus cash in the event the economy enters a substantial decline, whereas, in recent years, they may have looked at this as excess cash to spend.
Lastly, on the economic front, it is important to note that the U.S. dollar’s strength has increased against every major currency worldwide. Imports are likely to hold strong as the cost of foreign goods drop, while exports are likely to decline. It is hard to determine the overall impact these conflicting pressures will have on the domestic freight markets. Still, it will almost certainly cause challenges with the balancing of containers and other global trade equipment due to the increased disparity between imports and exports.