"*" indicates required fields
"*" indicates required fields
"*" indicates required fields

September 2021
The Arrive Monthly Market Update, created by Arrive Insights, is a report that analyzes data from multiple sources, including but not limited to FreightWaves SONAR, DAT, FTR Transportation Intelligence, Morgan Stanley Research, Bank of America Internal Data, Journal of Commerce, Stephens Research, National Retail Federation and FRED Economic Data from the past month as well as year-over-year.
We know that market data is vital to making real-time business decisions, and at Arrive Logistics, we are committed to giving you the data you need to better manage your freight.
Table of Contents
(Click to scroll to section.)
Conditions remain extremely challenging for shippers. Truckload demand has shown no signs of slowing down, throughput issues plague the entire supply chain, and our outlook for capacity conditions has deteriorated further. These trends indicate further spot rate growth is likely through the remainder of the year with tightness likely persisting through the first half of 2022.
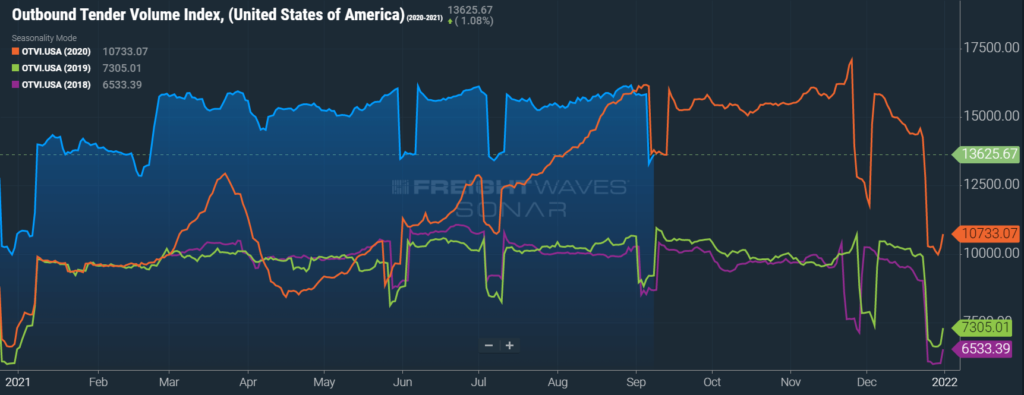
Tender Volumes are representative of nationwide contract volumes and act as an indicator of Truckload Demand
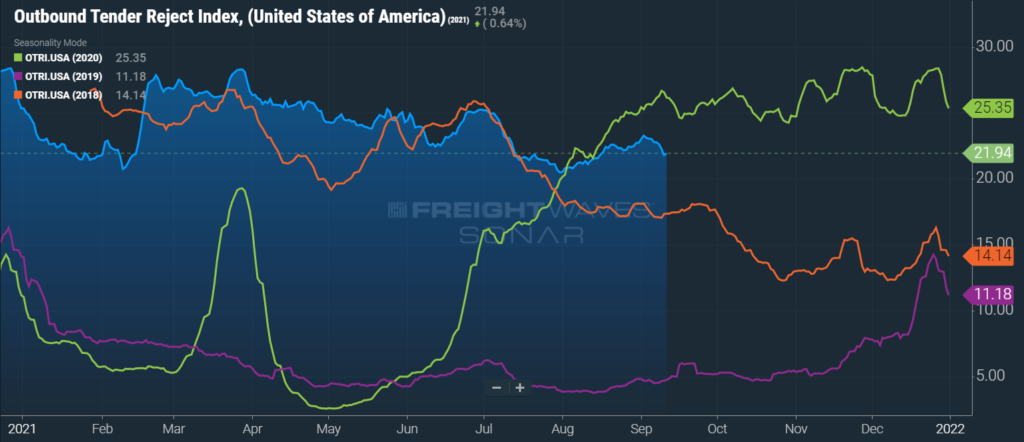
Tender Rejectionsindicate the rate at which carriers reject loads they are contractually required to take and acts as an indicator of the balance between Truckload Supply and Demand
New Truck Orders is an indicator of the trucking industry’s health and carrier sentiment, as carriers typically invest in new trucks when demand and optimism are high.
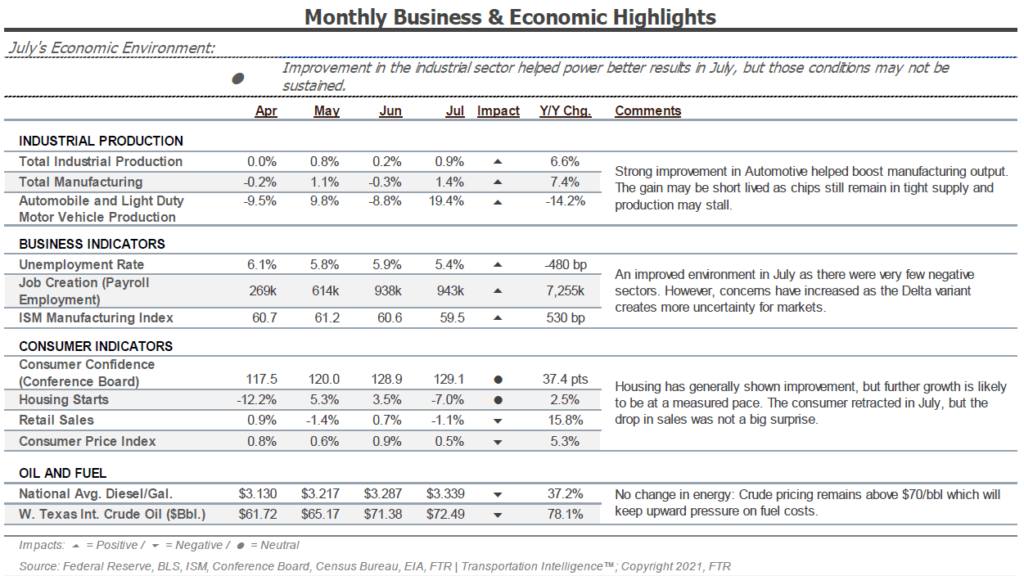
Industrial Production measures the output of the industrial sector, including mining, manufacturing and utilities.
US Customs Maritime Import Shipments, China to the United States measures the total number of import shipments being cleared for entry to the U.S. from China.
Rate Spread measures the difference between the national average contract rate per mile and the national average spot rate per mile and is closely inversely correlated to movements in tender rejections and spot market volumes.
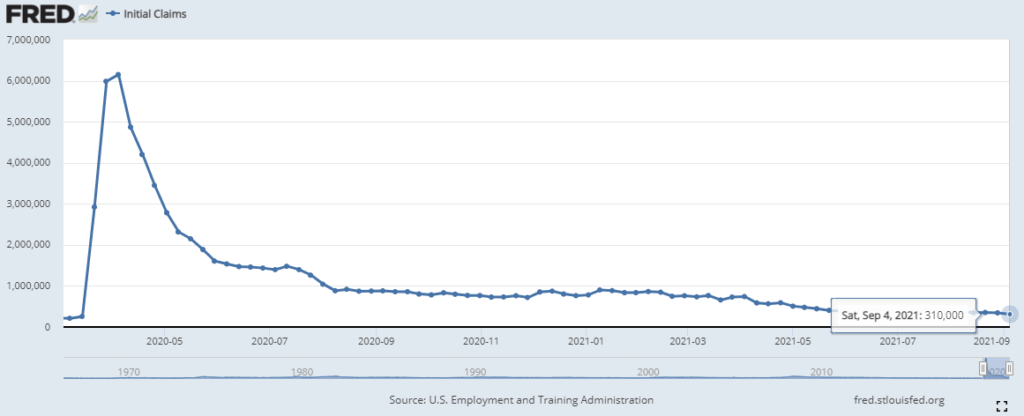
Weekly Jobless Claims are used as a barometer for the pace of layoffs in the general economy.
Unemployment Rate is the number of people who are unemployed that are actively seeking work.
"*" indicates required fields
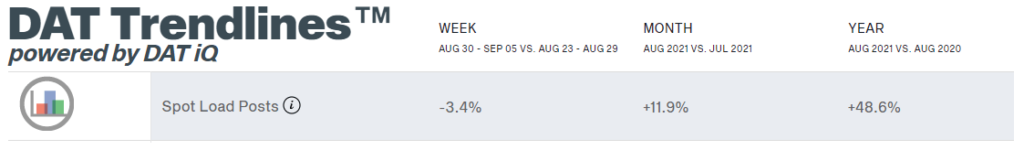
DAT reported dry van spot load posts fell 17.1% month-over-month in July but remained up by 45.8% year-over-year. This is a major pullback from JuDAT reported dry van spot load posts increased 11.9% month-over-month and 48.6% year-over-year in August. This is consistent with July, when year-over-year spot load posts were up 45.8%.
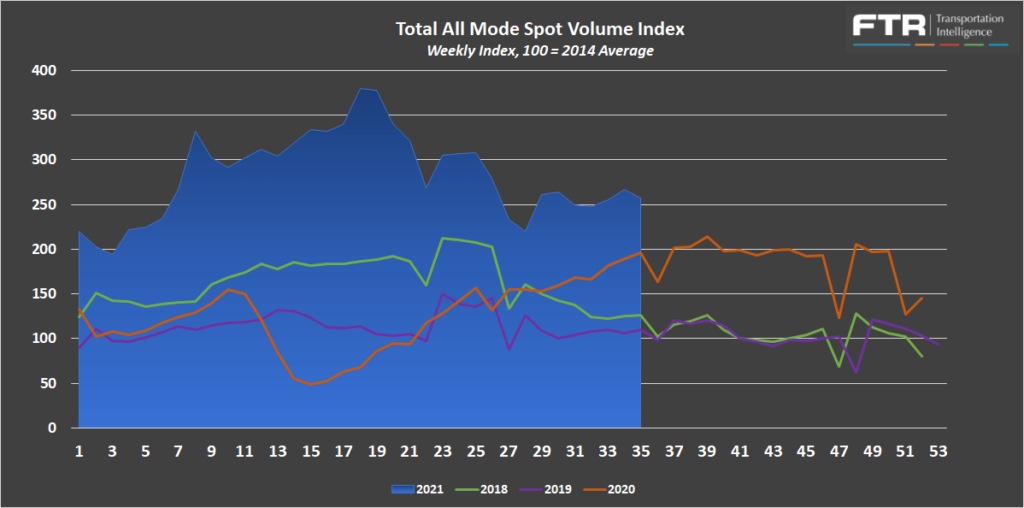
FTR and Truckstop’s Total All Mode Spot Volume Index finished August up 8% from the low seen mid-month and 2% from the last week in July. The all mode index remains up 41% year-over-year, down from 112% year-over-year at the end of June and 66% at the end of July. Despite mostly flat month-over-month trends, the declines in year-over-year growth rates are a result of rapidly rising rates a year ago.
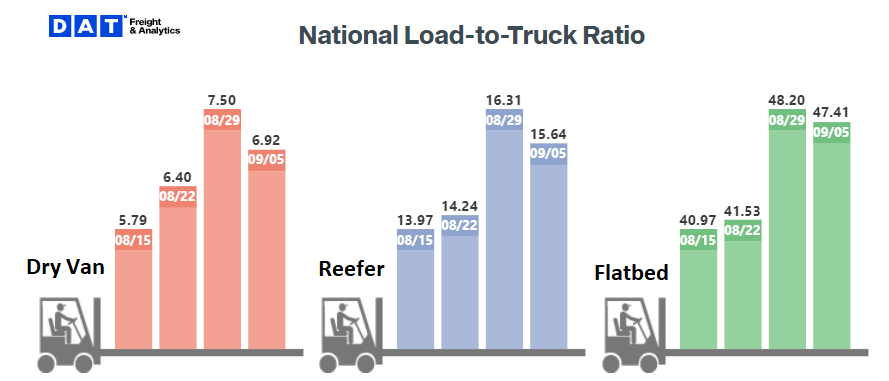
The DAT Load to Truck Ratio measures the total number of loads compared to the total number of trucks posted on their load board. In July, the Dry Van Load to Truck Ratio increased to 6.46, up 11.2% month-over-month and 21.7% year-over-year. The Reefer Load to Truck Ratio increased to 14.91, up 18.7% month-over-month and 60% year-over-year.
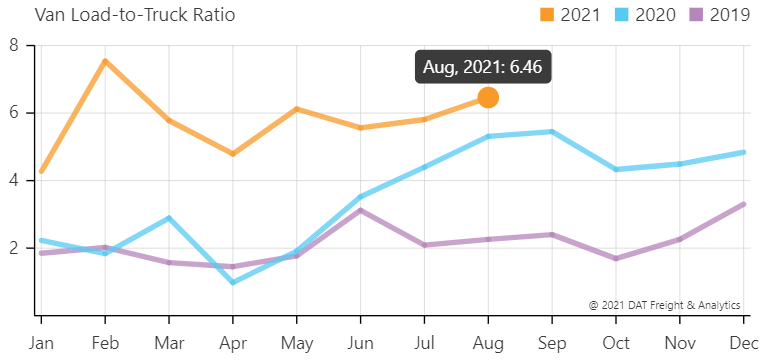
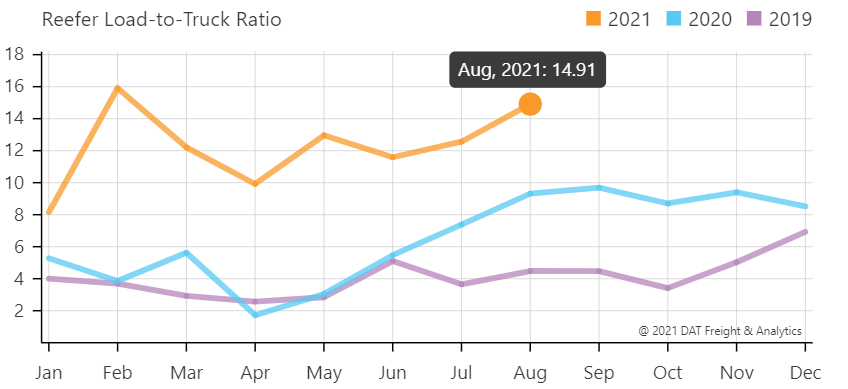
The weekly load to truck ratios show conditions continued to tighten throughout the month, before taking a step back the week of Labor Day across all three equipment types. Spikes seen in the last week of August were a result of tightening disruptions seen from Hurricane Ida, as well as the increase in demand commonly seen in the week leading up to Labor Day. If load to truck ratios remain elevated, expect to see further upward pressure on spot rates.
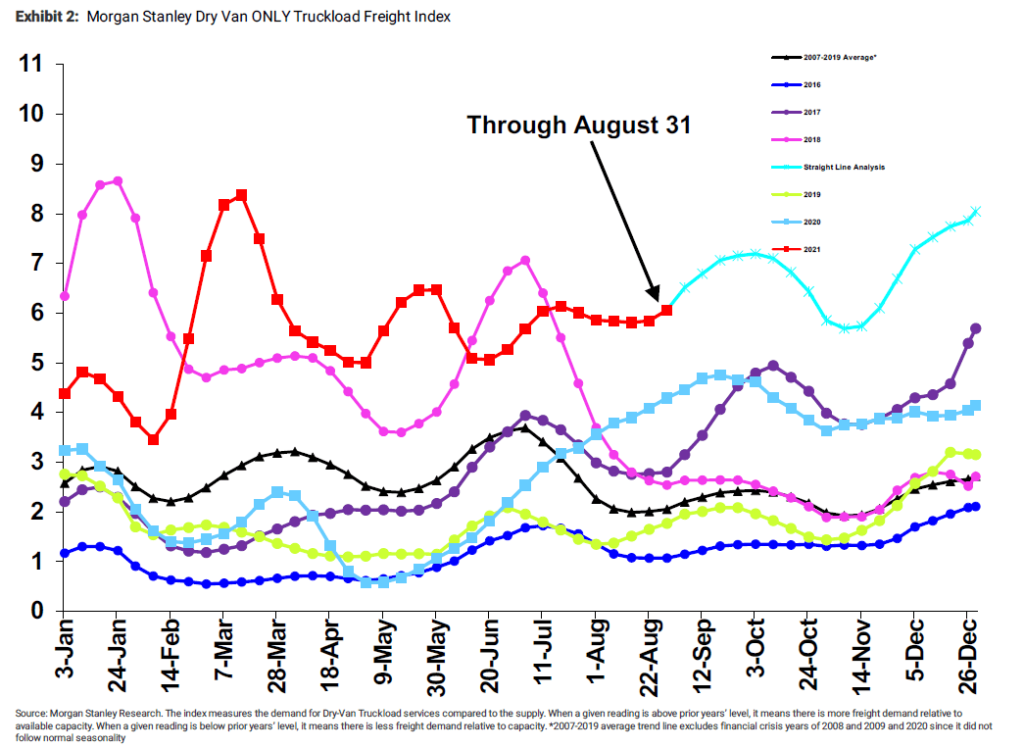
The Morgan Stanley Dry Van Freight Index is another measure of relative supply. The higher the index, the tighter the market conditions. According to the index, conditions remained mostly flat, but saw some tightening as of late. Looking forward, normal seasonality indicates tightening conditions throughout the remainder of the third quarter. Their straight-line forecast indicates we will see conditions finish the year well above any other year on the chart, with conditions near the level of tightness seen shortly following the winter storms earlier in the year.
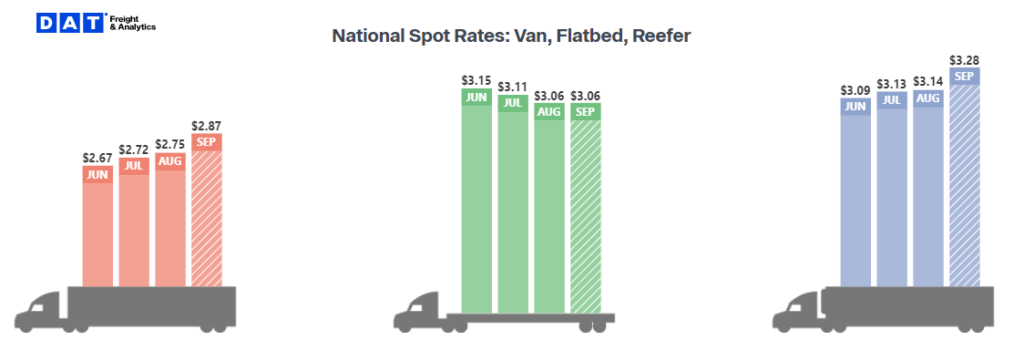
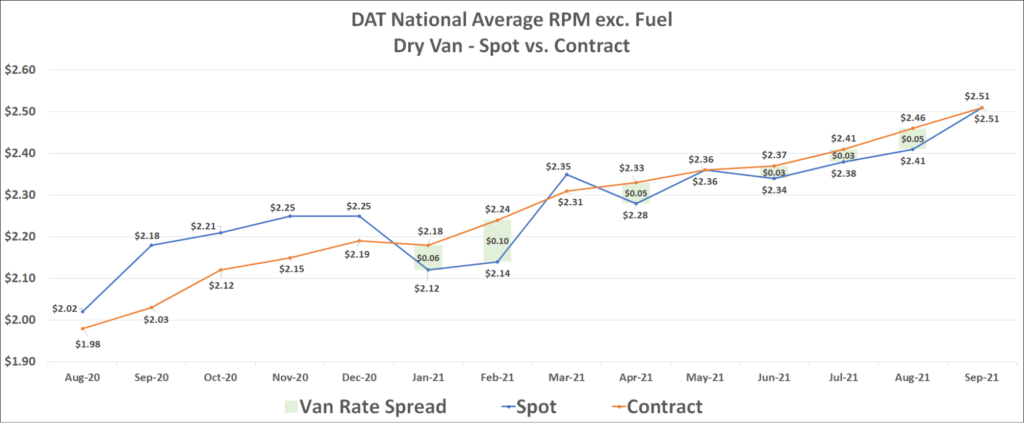
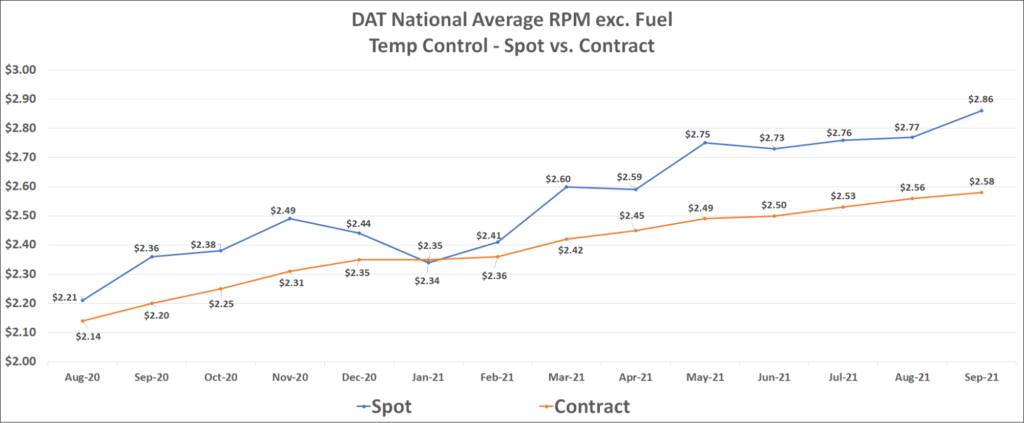
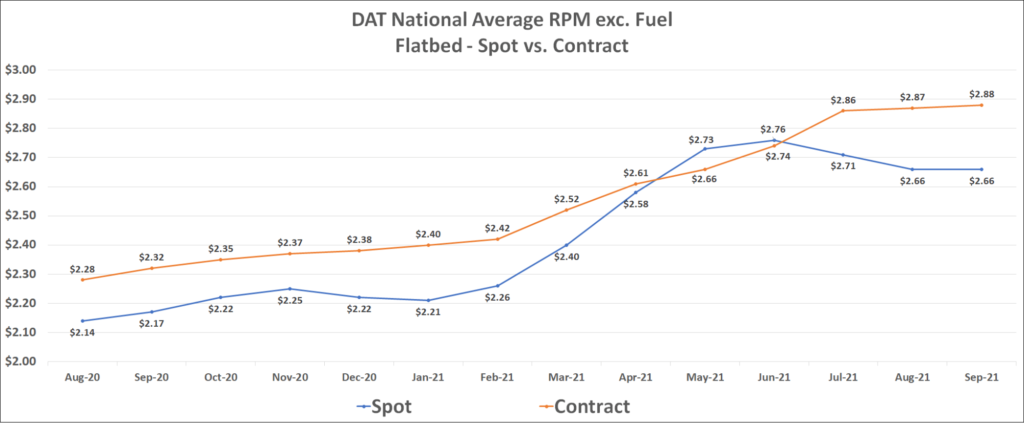
Dry van contract rates, which have not declined month-over-month since May 2020, reached a new all-time high in July of $2.51 per mile, excluding fuel. The same trend held true for both Reefer and Flatbed equipment, with both seeing respective, new all-time highs, of $2.56 and $2.87 per mile, excluding fuel, in August.
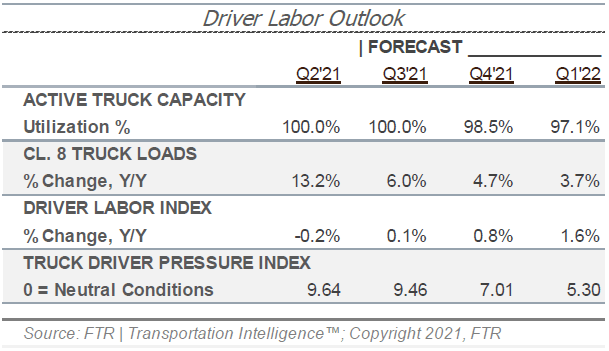
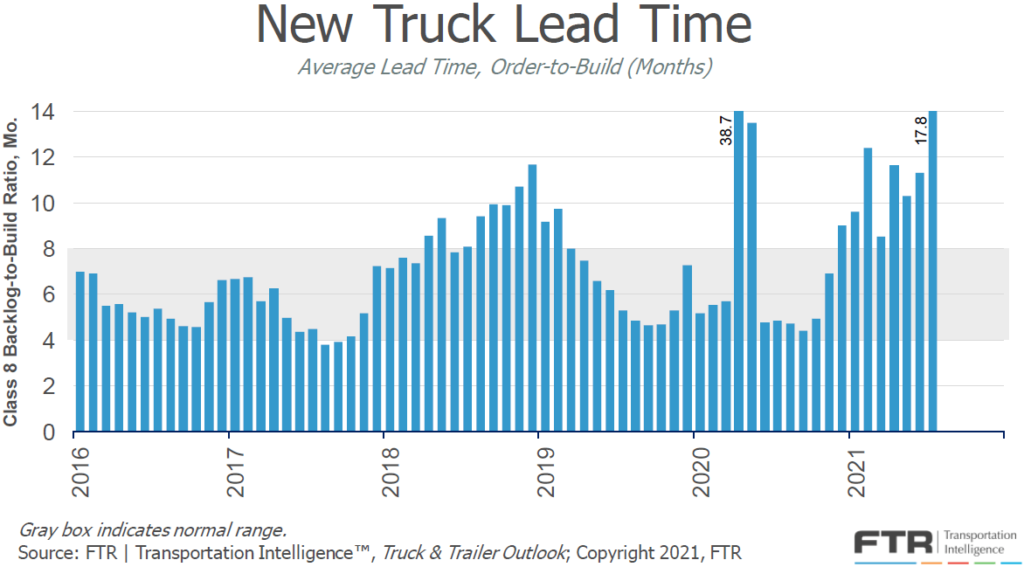
The equipment side of the equation also remains significantly challenged. In a recent webinar hosted by FTR, Don Ake, VP of Commercial Vehicles, provided his insights on the situation. He stated we have seen parts shortages, particularly semiconductors, result in significant production delays and backlogs for both new trucks and trailers. Even if semiconductor shortages were not a problem, other parts shortages would still result in an inability for OEMs to operate at full capacity. It is estimated that there is a deficit of 11,500 units per month for new trucks and a deficit of about 8,800 units per month for new trailers. New truck lead time, the time in months from when a new truck is ordered until it is delivered, jumped to 17.8 months. This is a result of production falling even further behind, an indication that the part shortages aren’t getting better as of late. It is still too early to predict when this situation will improve, but experts agree that once the supply chain issues for parts needed in truck and trailer production are resolved, it will still require many months to work through the current backlog.
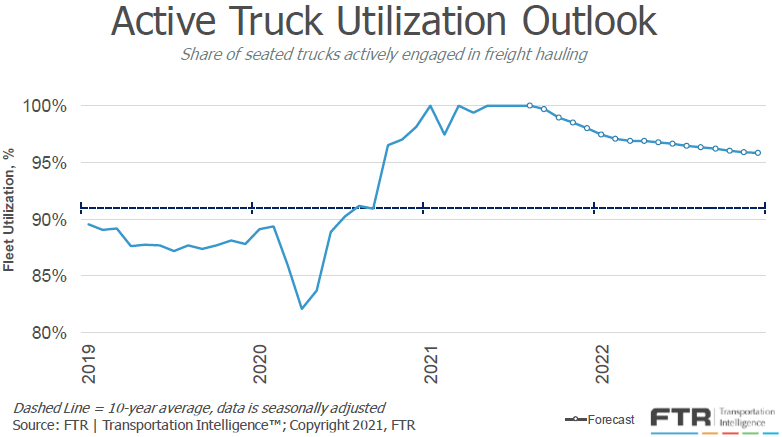
Given the severity of the outlook for new equipment, FTR’s forecast for truck utilization, the share of seated trucks actively engaged in freight hauling, shows active truck utilization remaining above 98% or higher through the remainder of 2021 and above 96% through 2022. For a point of reference, the average active truck utilization over the past ten years is 91%.
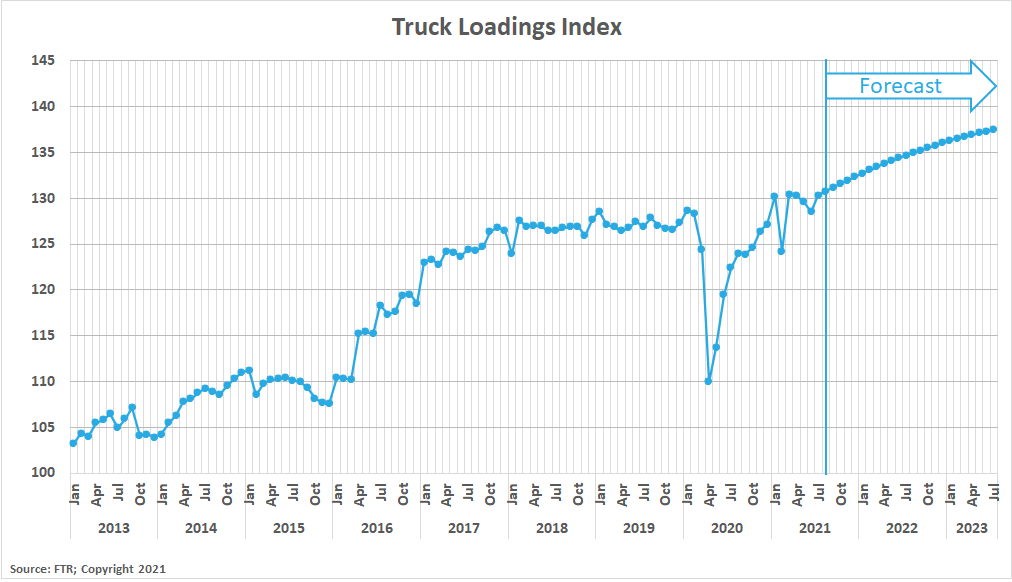
There are signs that the growth we have seen as a result of stimulus is slowing, but overall, the outlook for the economy remains relatively strong. Job and wage gains should support continued consumer spending and industrial production, and manufacturing should continue to drive healthy freight volumes. There is no reason to believe we should see meaningful reductions in truckload demand in the short term.
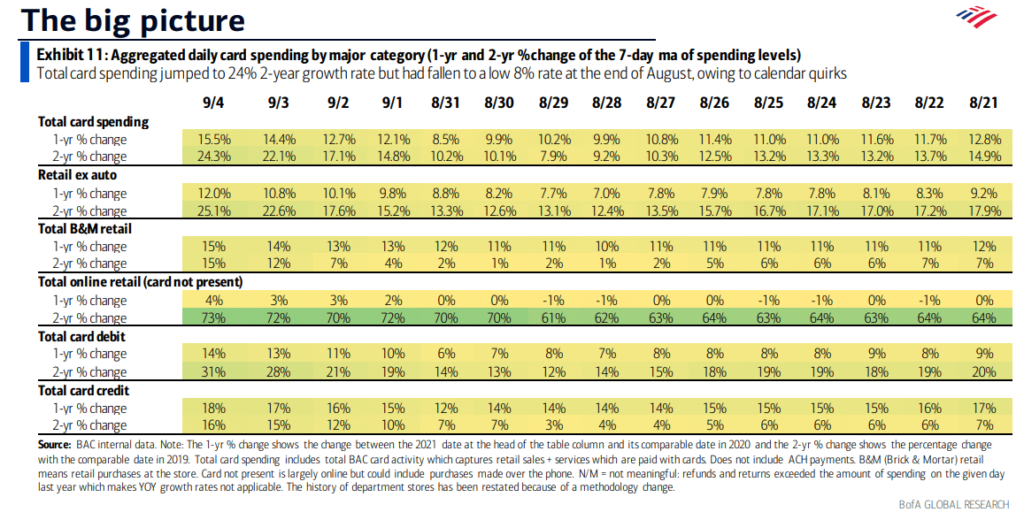
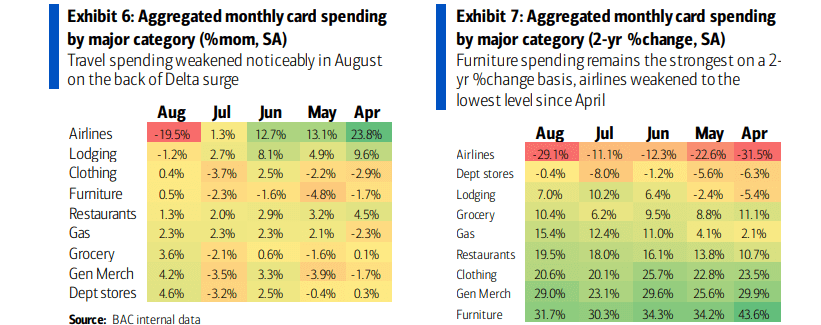
One of the main factors BofA is watching as it relates to spending is the impact of the Delta variant rise. The biggest impact has been seen on travel, with airline spending down 19.5% month-over-month, seasonally adjusted, in August. This was the largest drop since January 2021 and leaves total airline spending, on a 2-year basis, at the lowest level since April.
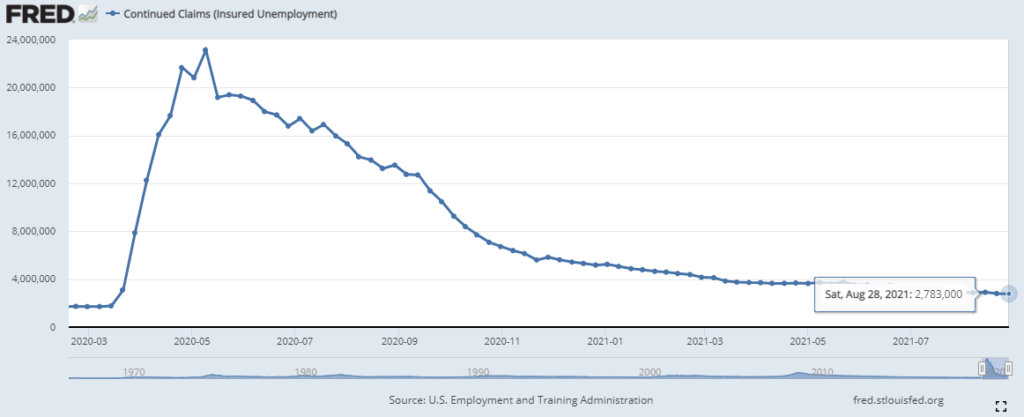
The unemployment trends continued to gradually improve in August. Initial claims in the most recent week came in at 310,000, down from 385,000 from last month and the lowest total since the start of the pandemic. Continued claims are also at their lowest levels since the start of the pandemic, down to 2.78 million from 2.93 million last month, on a weekly basis.