
The FreightWaves SONAR Outbound Tender Volume Index (OTVI), which measures contract tender volumes across all modes, was down 22.3% year-over-year as of September 1st.
Of course, it is important to note that OTVI includes both accepted and rejected load tenders, so we must discount the index by the corresponding Outbound Tender Rejection Index (OTRI) to uncover the true measure of accepted tender volumes. The downward tender volume trend dropped to 4.8% below last September when applying this method to year-over-year OTVI values. The adjusted month-over-month index was up just shy of 1% from early August, indicating relatively flat contract volumes from a month ago.
Tender rejections are down 75%, from 23.02% a year ago to 5.64%, which helps explain the lower negative year-over-year growth trend in accepted tender volumes compared to the decline in total tender volumes.
As for specific equipment types, the dry van tender volume index was down 23.2%, and the reefer tender volume index was down by 28.5%, equating to a 5.2% year-over-year decrease for actual van volumes and a 4.6% increase in actual reefer volumes. Dry van tender rejections are down more than 76% year-over-year. For reefer equipment, that number is nearly 80%.
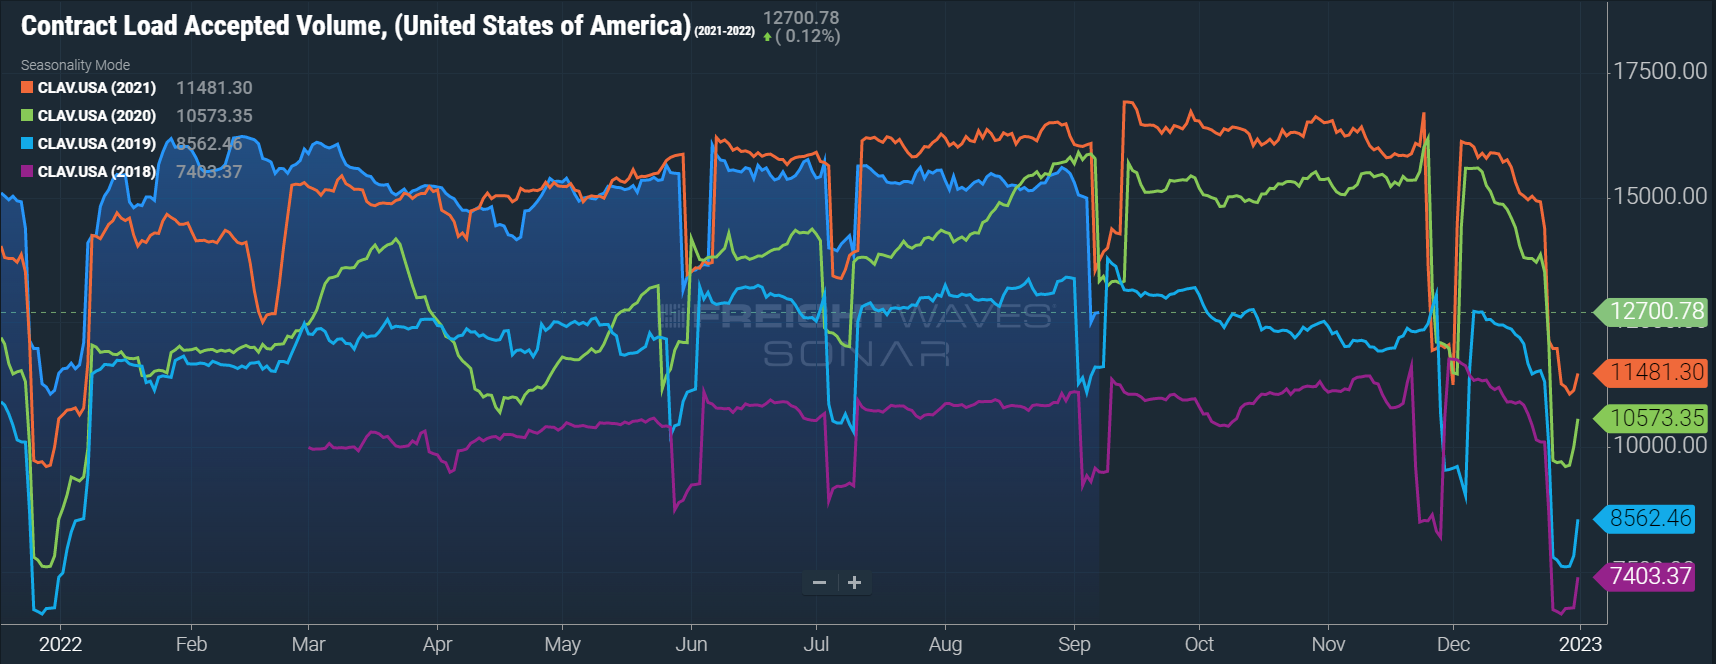 Accepted contract volumes are down 4.8% y/y in early September, but remain above historical levels.
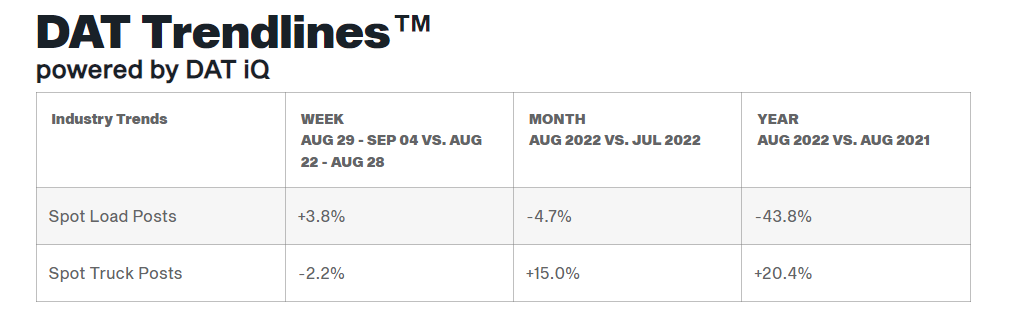
As seen in recent months, spot market demand has suffered as shippers continue to experience strong routing guide compliance. DAT data indicates that year-over-year spot volumes were down by 43.8% in August after falling 4.7% month-over-month from July.
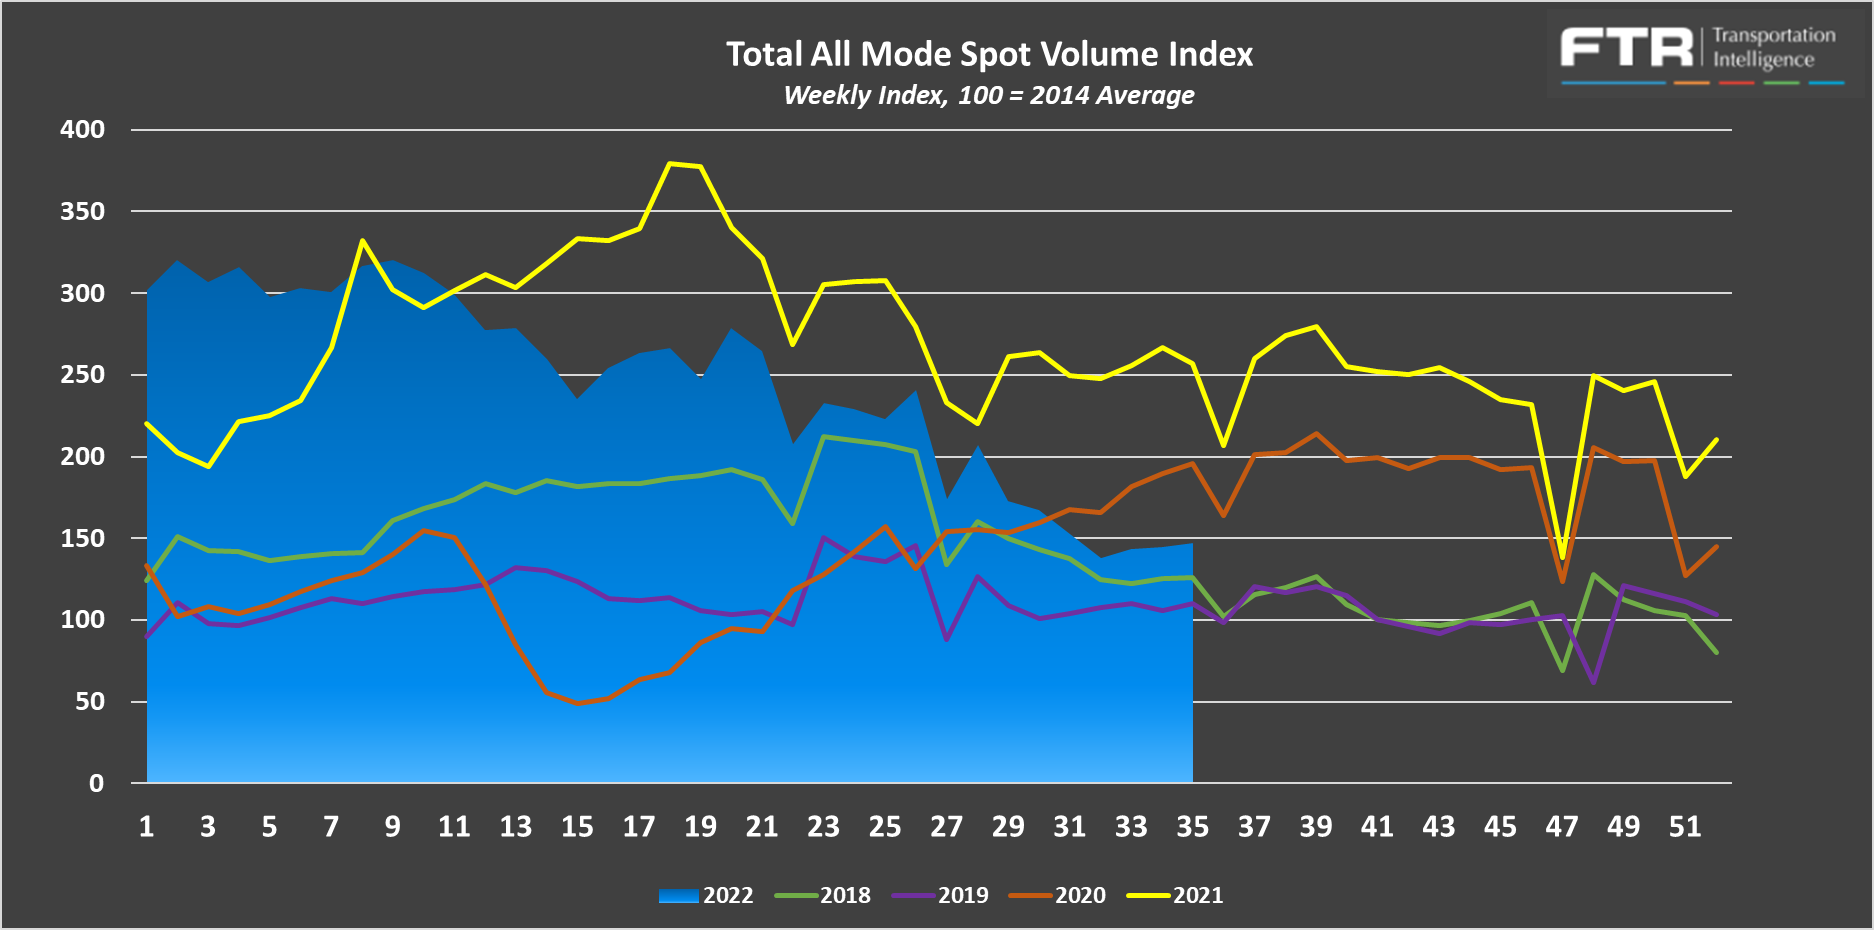
FTR and Truckstop’s Total All Mode Spot Volume Index helps illustrate that even though spot volumes are down from last year, they remain in line with pre-pandemic levels. The All Mode Index is now down 43% year-over-year but is up 33% from 2019.
The Sonar Outbound Tender Rejection Index (OTRI) measures the rate at which carriers reject the freight they are contractually required to take. The rate is 5.57% in early September, which indicates shippers are seeing extremely high routing guide compliance on their contractual freight, matching expectations coming into the month.
Rejection rates continue to approach 2019 levels, easing seasonal demand and the gap between spot and contract rates being the main contributors to monthly declines.
Typical trends would signal slight tightening throughout the month as seasonal demand ramps up. However, there are no indications we will see demand get high enough to be disruptive, given how elevated contract rates remain above spot rates. As a result, we don’t expect any noticeable jump at the national level until at least mid-November, in the weeks leading up to Thanksgiving.
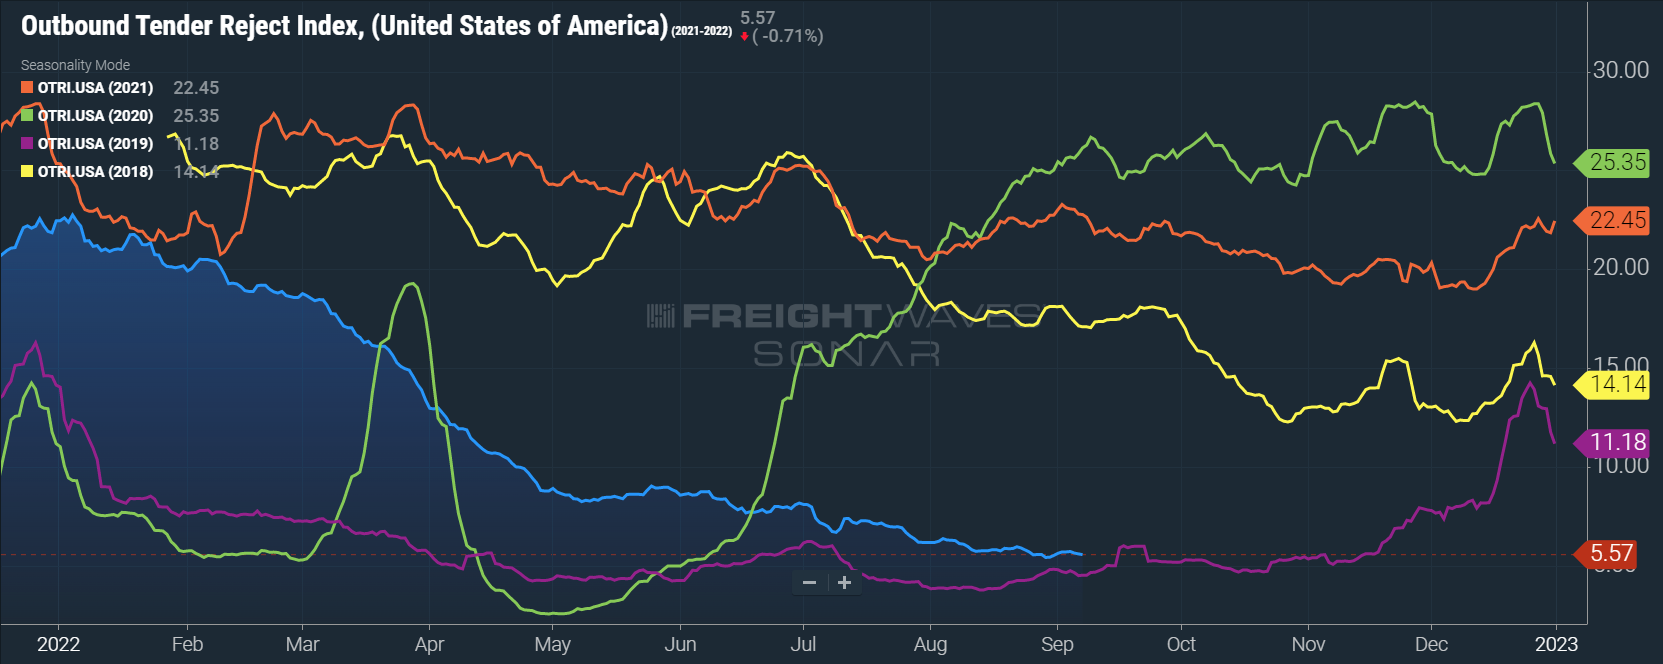 OTRI continued to normalize to equilibrium levels throughout August and early September, falling to nearly 5.5%. A sign that strong routing guide compliance is here to stay.
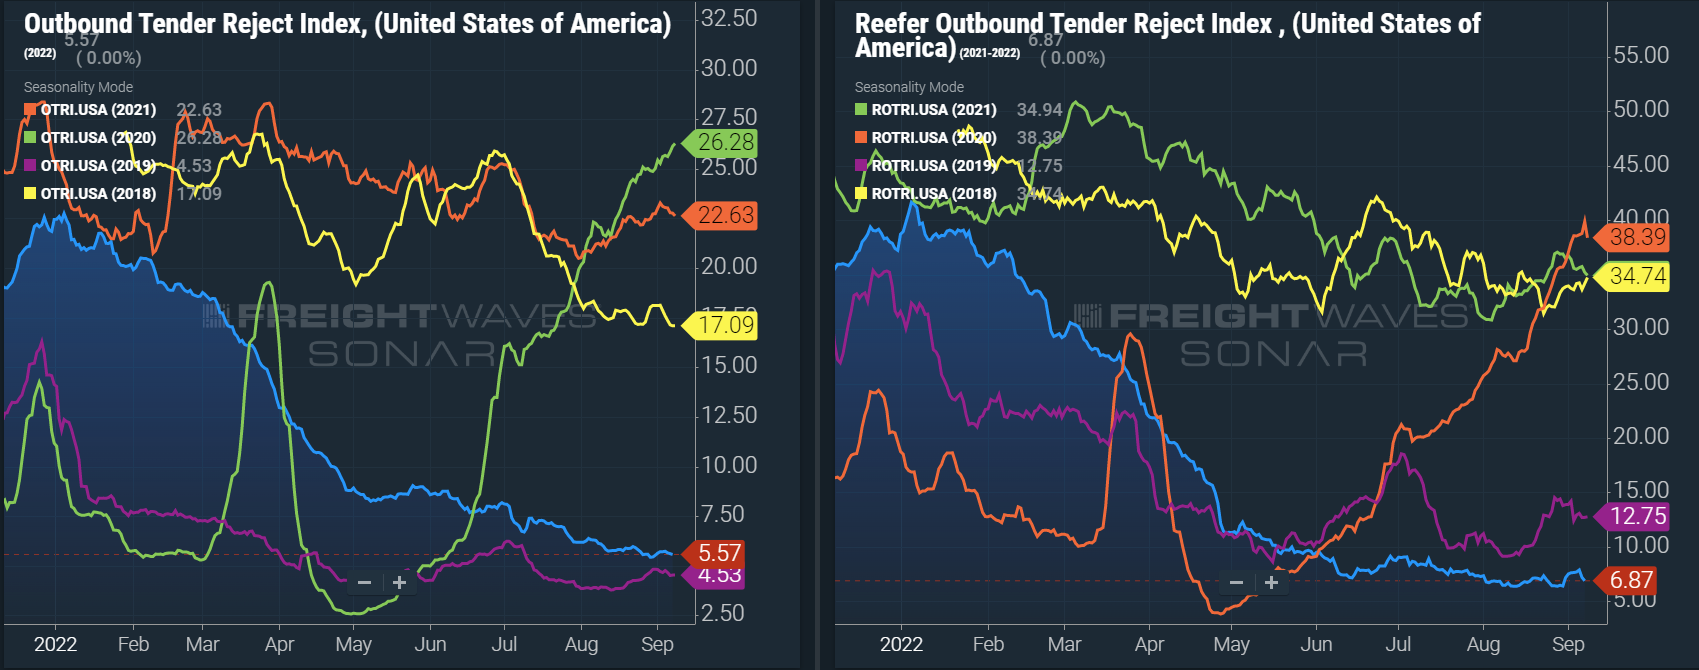 Dry van and Reefer tender rejections followed a similar trend to the all mode index, continuing to normalize through August and early September.
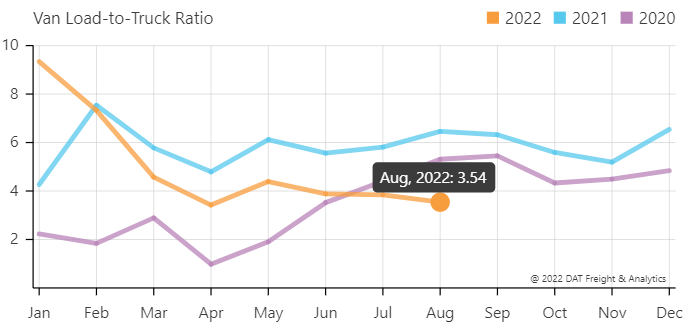
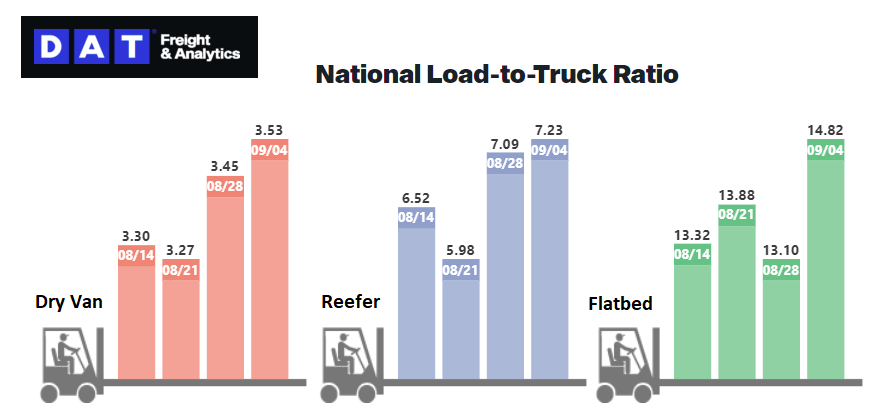
The DAT Load to Truck Ratio measures the total number of loads compared to the total number of trucks posted on their spot load board. In August, the Dry Van Load to Truck Ratio fell to 3.54, down just 7.9% month-over-month and 45.2% year-over-year. A ratio in the 3-4 range is pretty typical of equilibrium market conditions where supply is sufficient to meet demand. Considering the significant decline in spot volumes, it is no surprise that the spot load-to-truck ratio is in this range.
The Reefer Load to Truck Ratio fell to 7.08, down 2.2% month-over-month and 52.5% year-over-year. 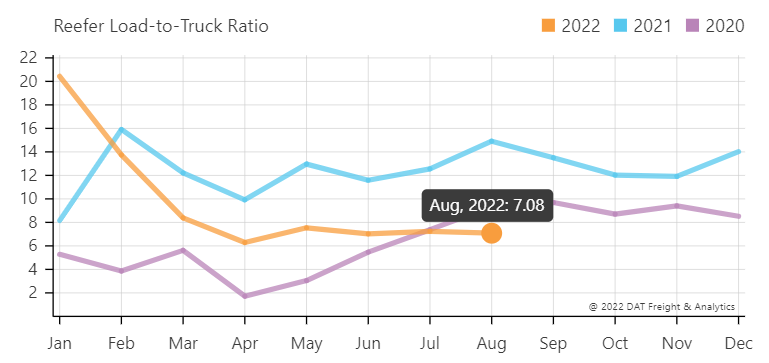
Weekly load-to-truck ratios for van and reefer saw some tightening around Labor Day but are likey to ease as September progresses. However, we could see some short-lived volatility at the end of the month and quarter.
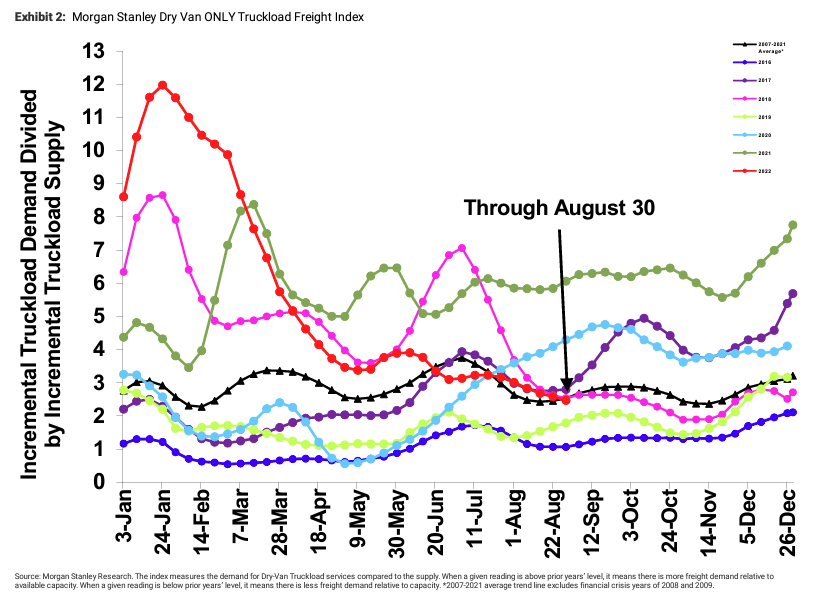
The Morgan Stanley Dry Van Freight Index is another measure of relative supply. The higher the index, the tighter the market conditions.
Data from August showed continuing softening of capacity conditions, largely in line with historical seasonality. The black line with triangle markers on the chart provides a great view of what directional trends would be in line with normal seasonality based on historical data dating back to 2007. Although this data would lead us to believe that we should start to see some tightening through the end of the month, we anticipate minimal tightening, given how dead the spot market is and how strong contract compliance remains.
Fuel trends remained highly volatile throughout the last month. On August 1st and 29th, the national average price per gallon of diesel was almost the same. However, throughout the month, the average price per gallon fell by more than $0.20 and then jumped back up. We believe that as long as fuel prices remain elevated, shippers will be looking for cost savings in other areas, leading to continued downward pressure on linehaul rates.
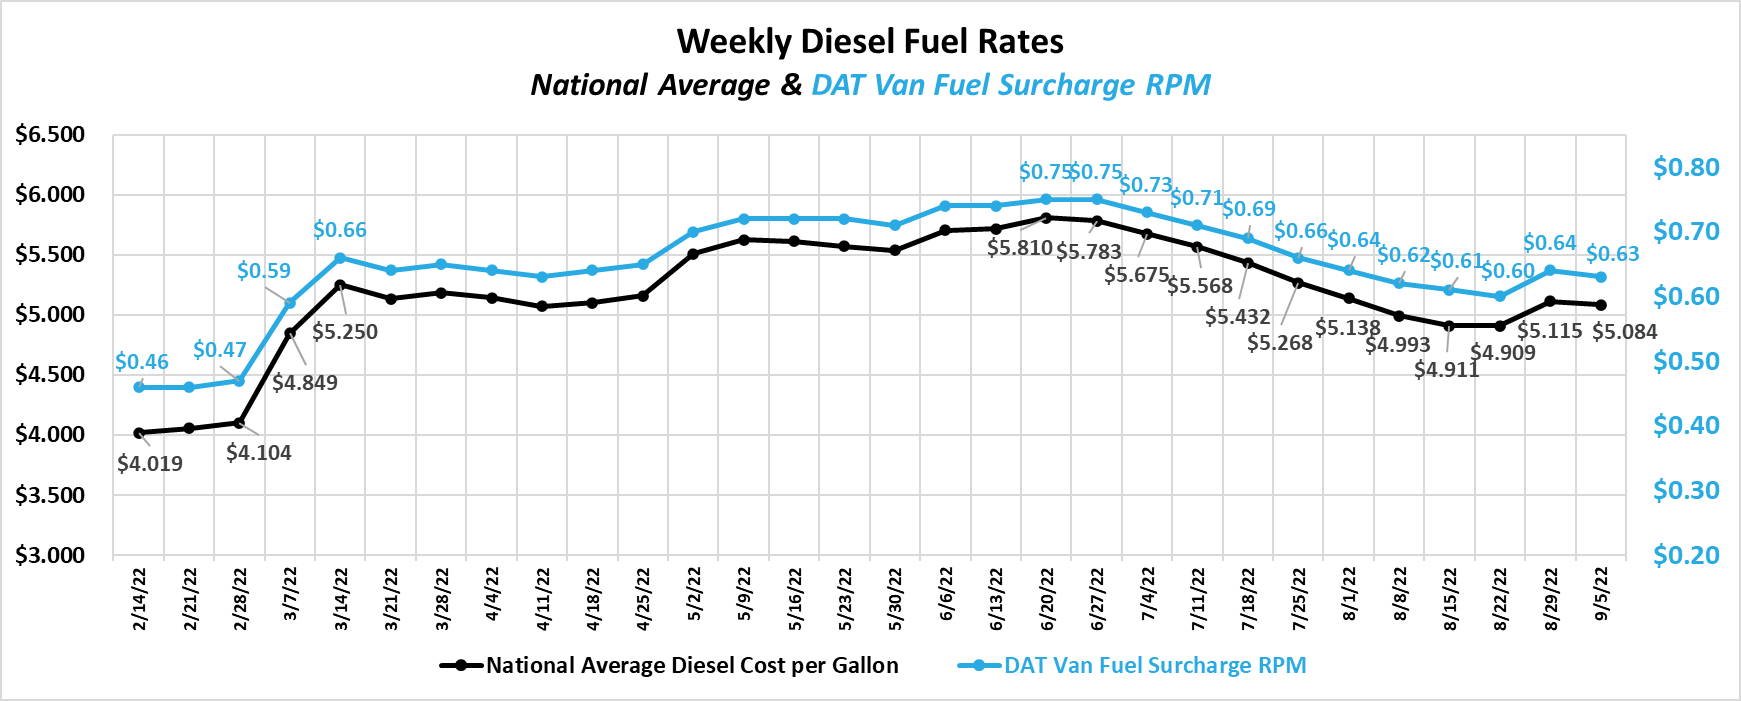
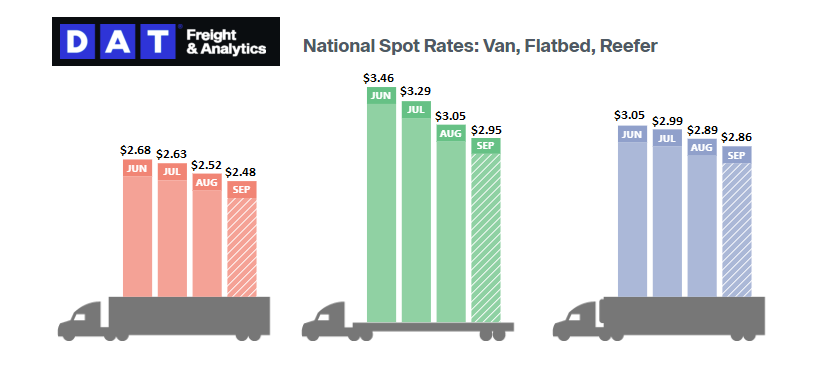
Trends for all-in spot rates, including linehaul and fuel costs, continue to show sequential declines month-over-month. With the monthly average price increasing slightly from August to early September, these declines result from reductions in the linehaul component of the rate. For example, all-in dry van spot rates have fallen by $0.05 month-over-month — from $2.52 per mile in August to $2.47 in early September. The average fuel surcharge has increased by $0.01 per mile over that same period, indicating linehaul rates are down $0.06 per mile.
As noted above, we have begun to see meaningful linehaul reductions into early September for both spot and contract rates. With van contract rates still elevated significantly above spot rates, we expect to see ongoing downward pressure on contract rates until the gap between them closes further. Early indications show a significant downward trend in the contract linehaul rate per mile in September, marking the first month since July 2020 that the year-over-year growth trend has been negative.
The current dry van contract rate is $2.41 per mile, excluding fuel — a decrease of 2.8% from $2.48 per mile in September 2021. Although linehaul rates are down year-over-year, all-in rates remain up by 7.4% due to increased fuel costs. We have now seen an 8% decline from the February peak of contract rates, excluding fuel, with still no floor in sight.
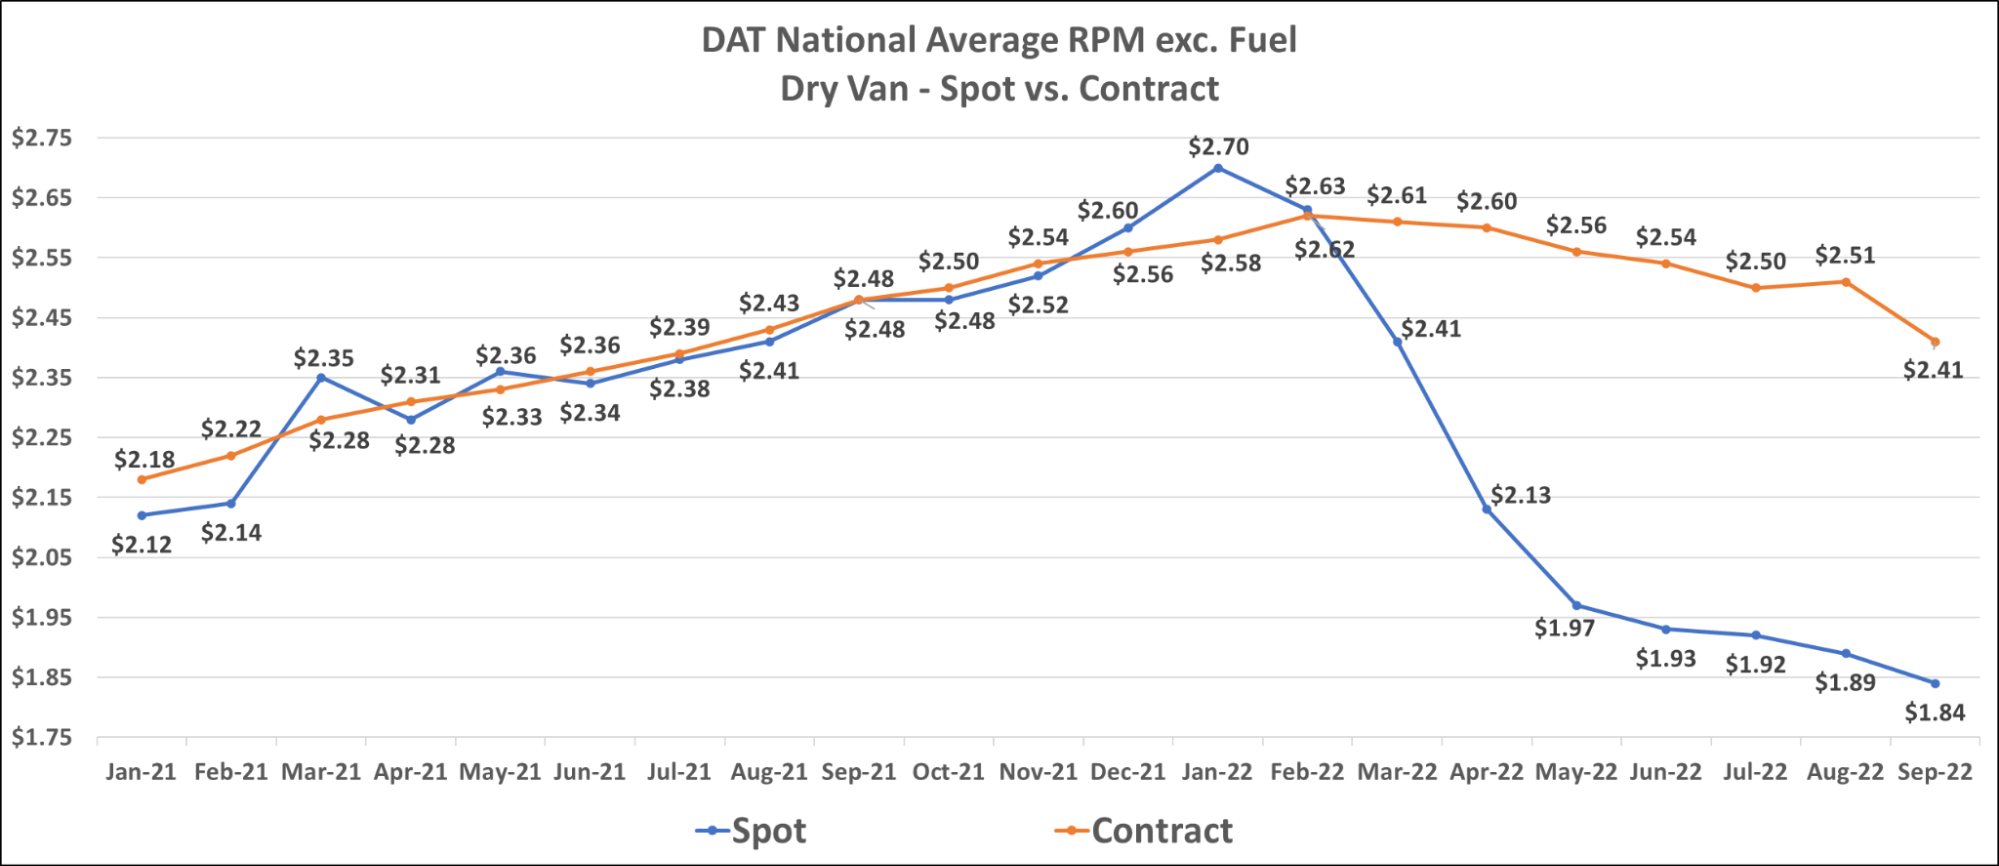 Dry Van spot and contract rates have trended down into early September, with no signs of a floor being reached.
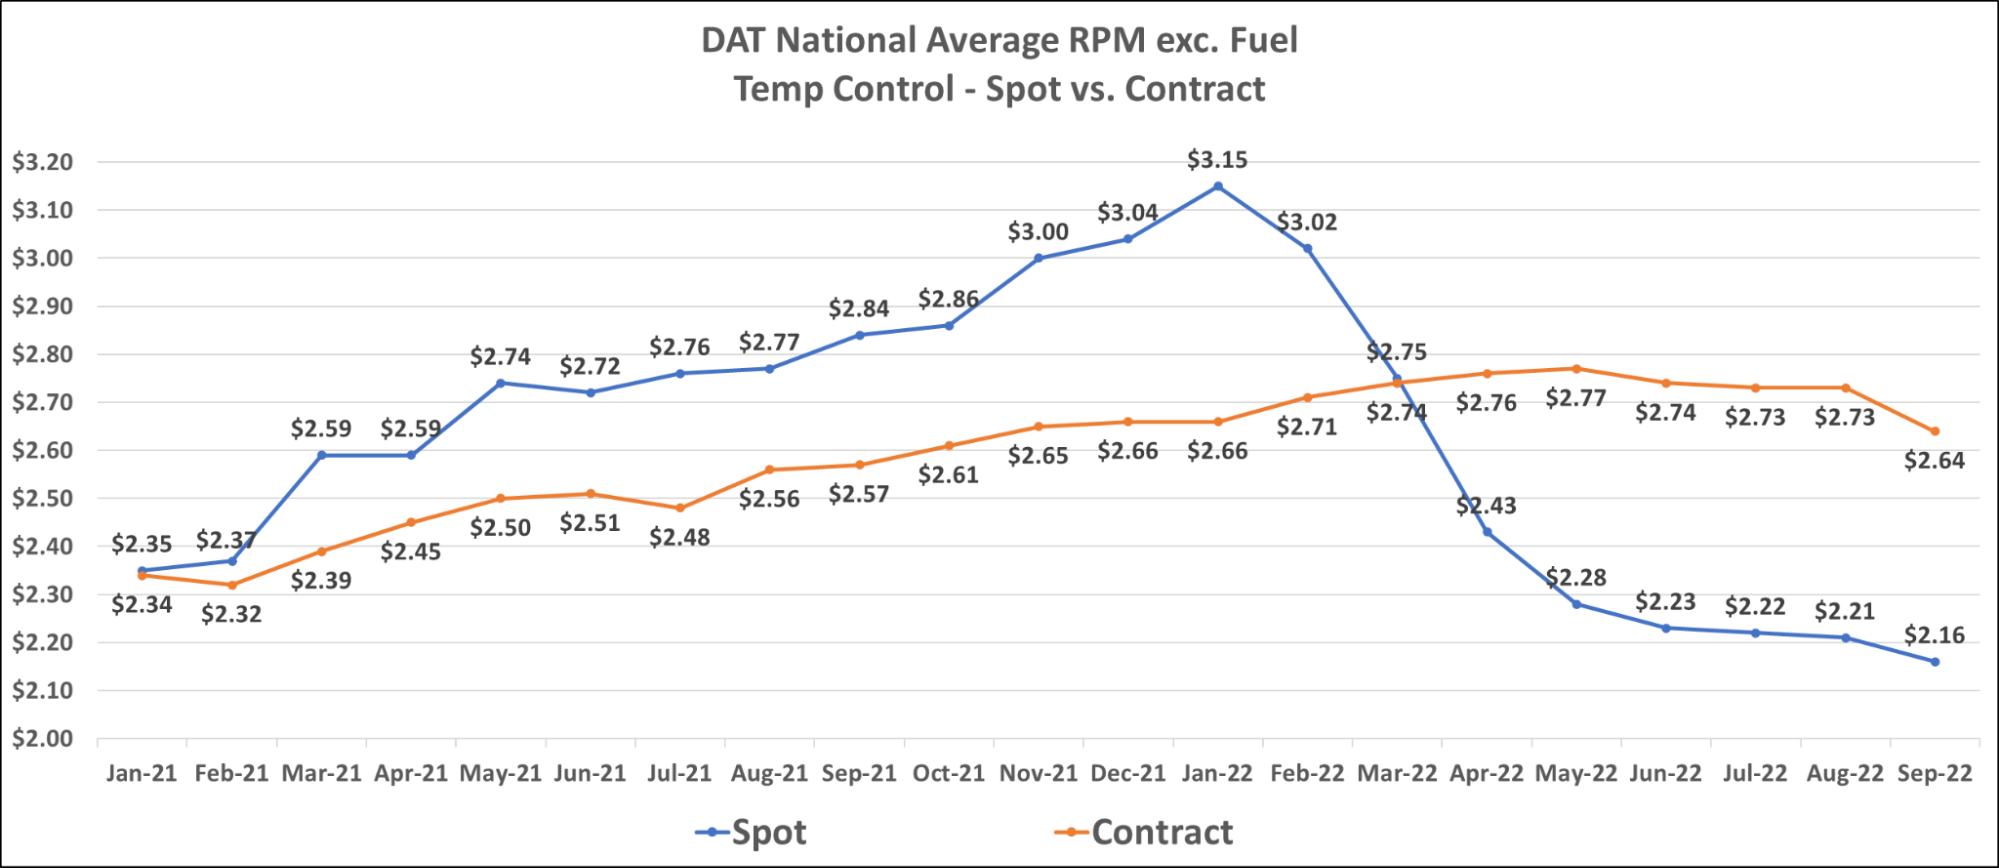
Reefer spot and contract rates have followed a very similar trend to van rates, falling steeply into early September. The current reefer contract rate is $2.64 per mile, excluding fuel. An increase of 2.7% from $2.57 per mile in September 2021. The current reefer spot rate is $2.16 per mile, excluding fuel. A decrease of nearly 24% from $2.84 per mile in September 2021.
As the fall harvest season progresses, we expect to see some regional tightness continue in the typical areas such as Washington, Idaho, Minnesota, Wisconsin, Michigan, Pennsylvania and New York. We also expect outbound California produce demand to remain steady for a few more weeks before tapering off in the fourth quarter.
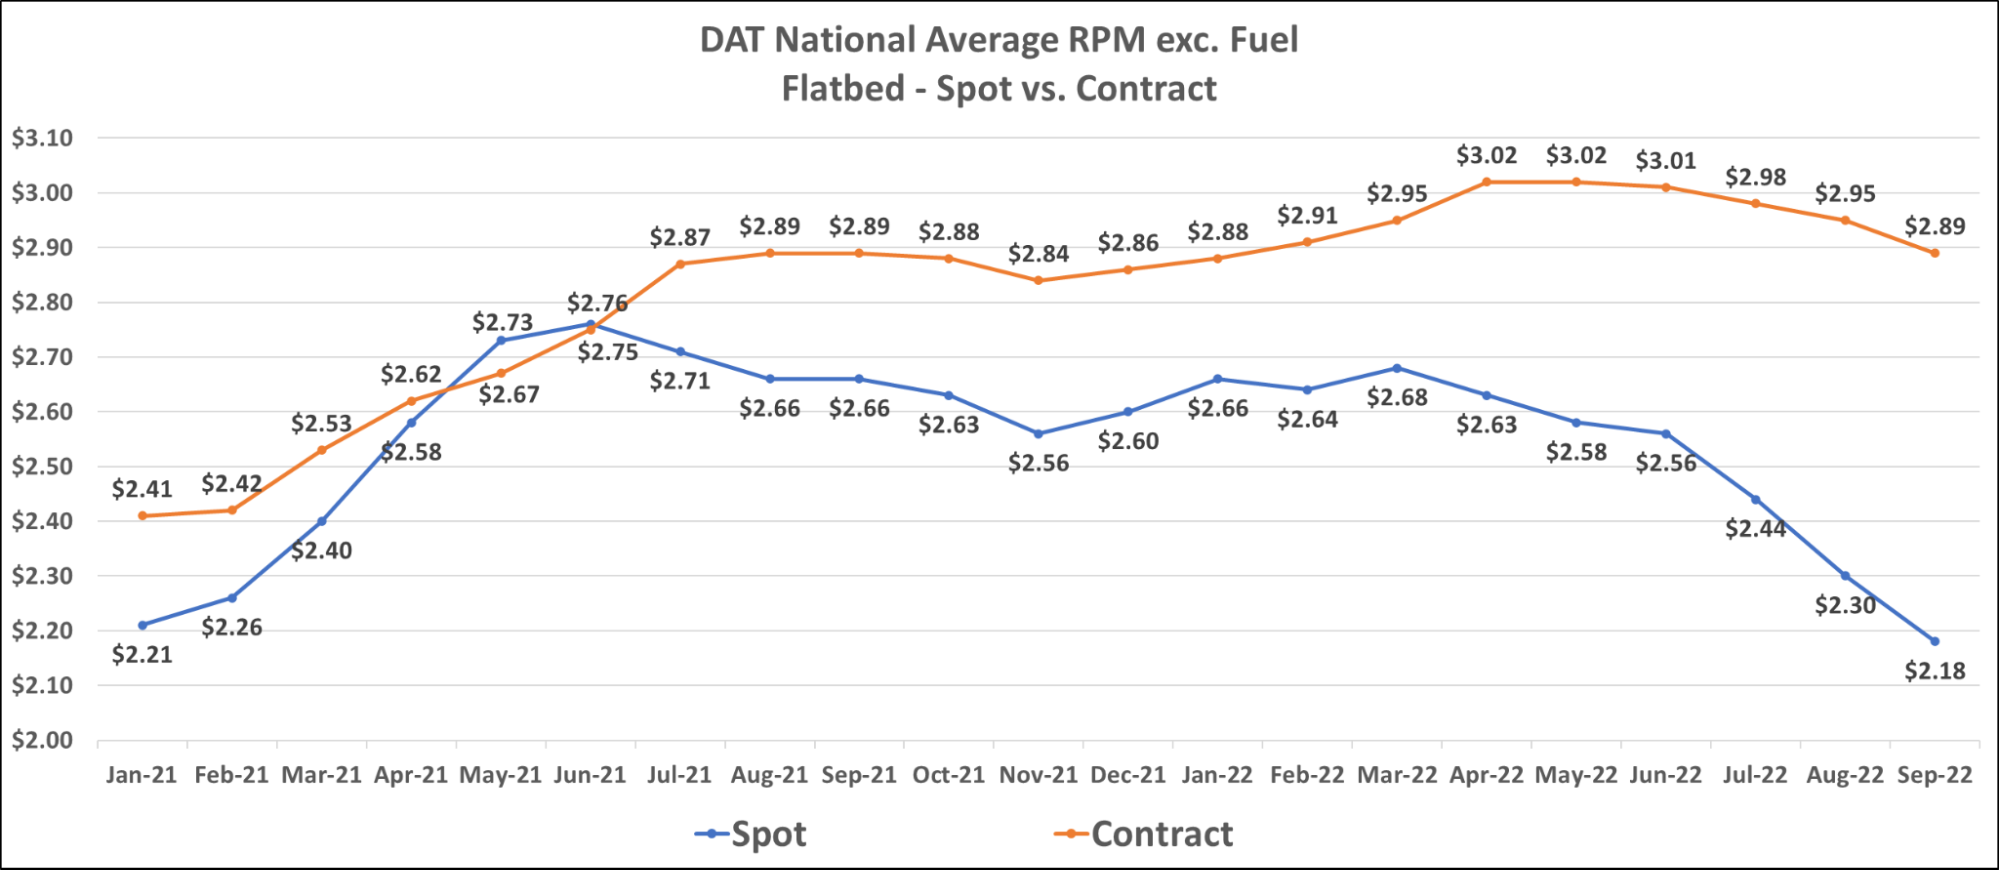
The flatbed market was not immune from the steep van and reefer rate declines in early September. The current flatbed contract rate is $2.89 per mile, excluding fuel. The decrease of $0.06 month-over-month now puts flatbed contract rates into flat year-over-year growth territory, which is dead even compared to September 2021. The current flatbed spot rate is $2.18 per mile, excluding fuel. A decrease of 18% from $2.66 per mile in September 2021.
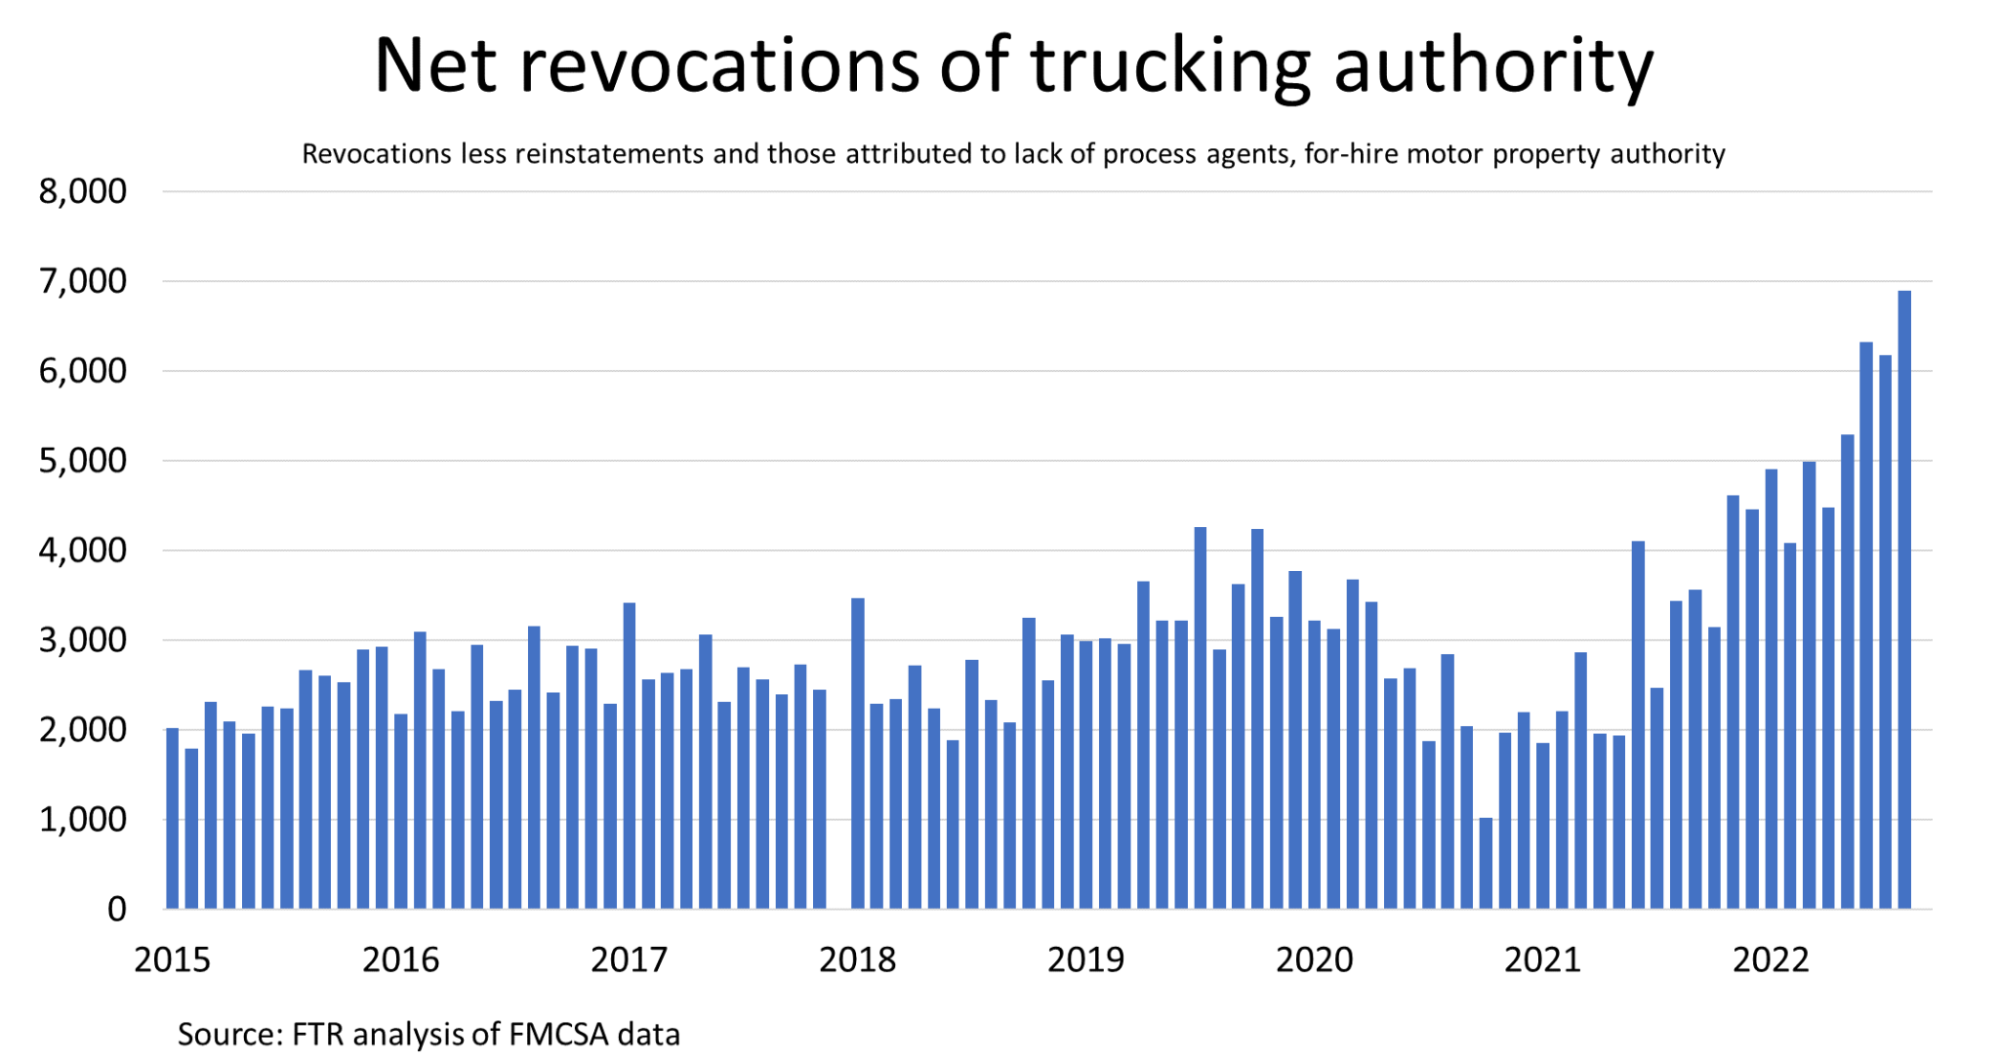
Fewer carriers are entering the market while a record number are giving up operating authority. This comes as no surprise, given that operating costs are higher than ever and spot rates are still experiencing significant declines. As calculated by the FTR, net revocations of trucking authority came in at an all-time high in August, excluding those associated with a lack of designated process agent. Elevated revocations of authority are expected to continue if current trucking conditions persist.
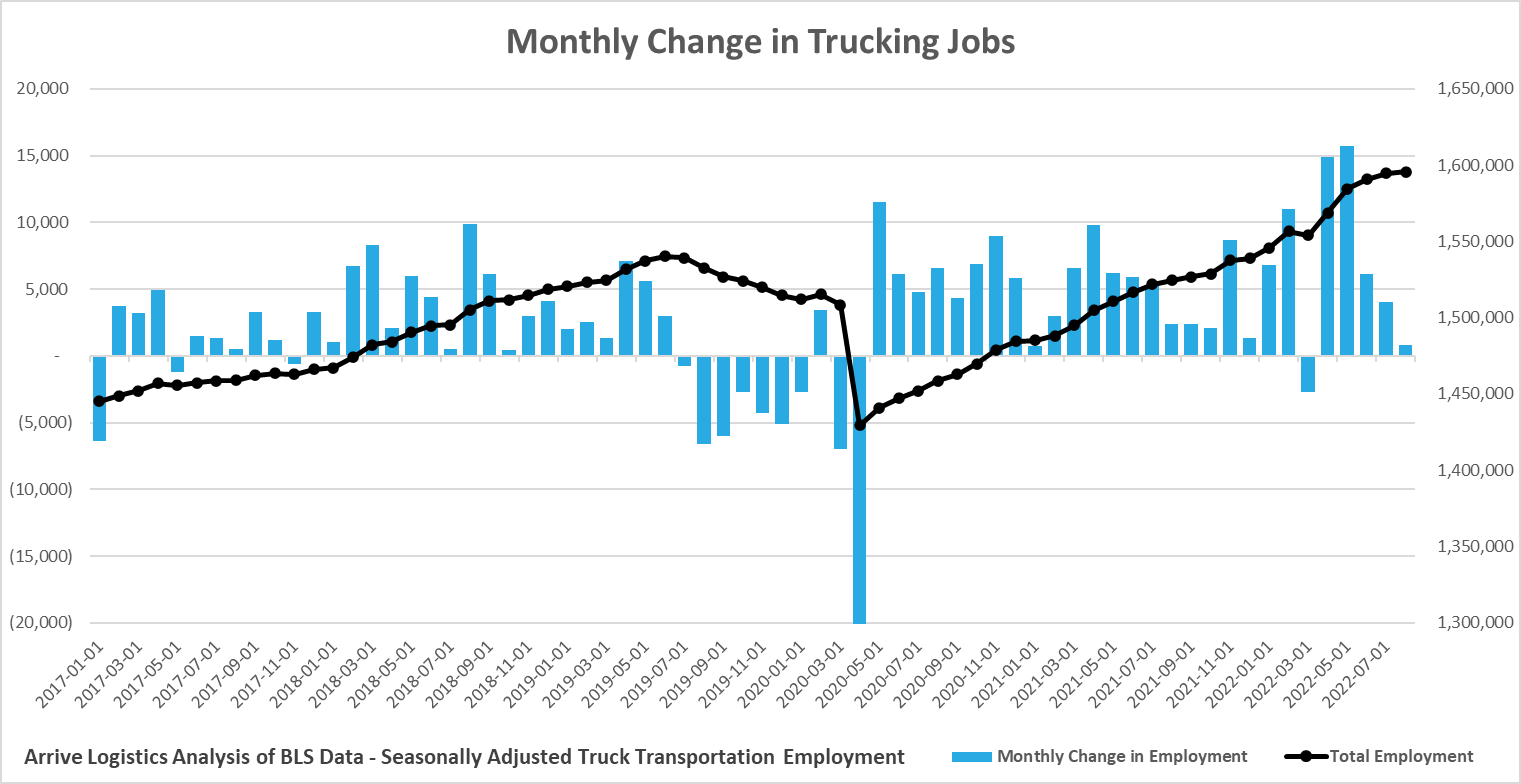
Despite the rise in trucking authority revocations, the period from February to July saw strong trucking job growth. The interpretation was that owner-operators and drivers were shutting down their private businesses in favor of taking company jobs. Excluding March of this year, August job growth dropped to the lowest level since January 2021. Total employment increased to a new all-time high; however, if job growth remains slow and revocations of authority remain elevated, it is likely only a matter of time before we see total employment trend in the opposite direction.
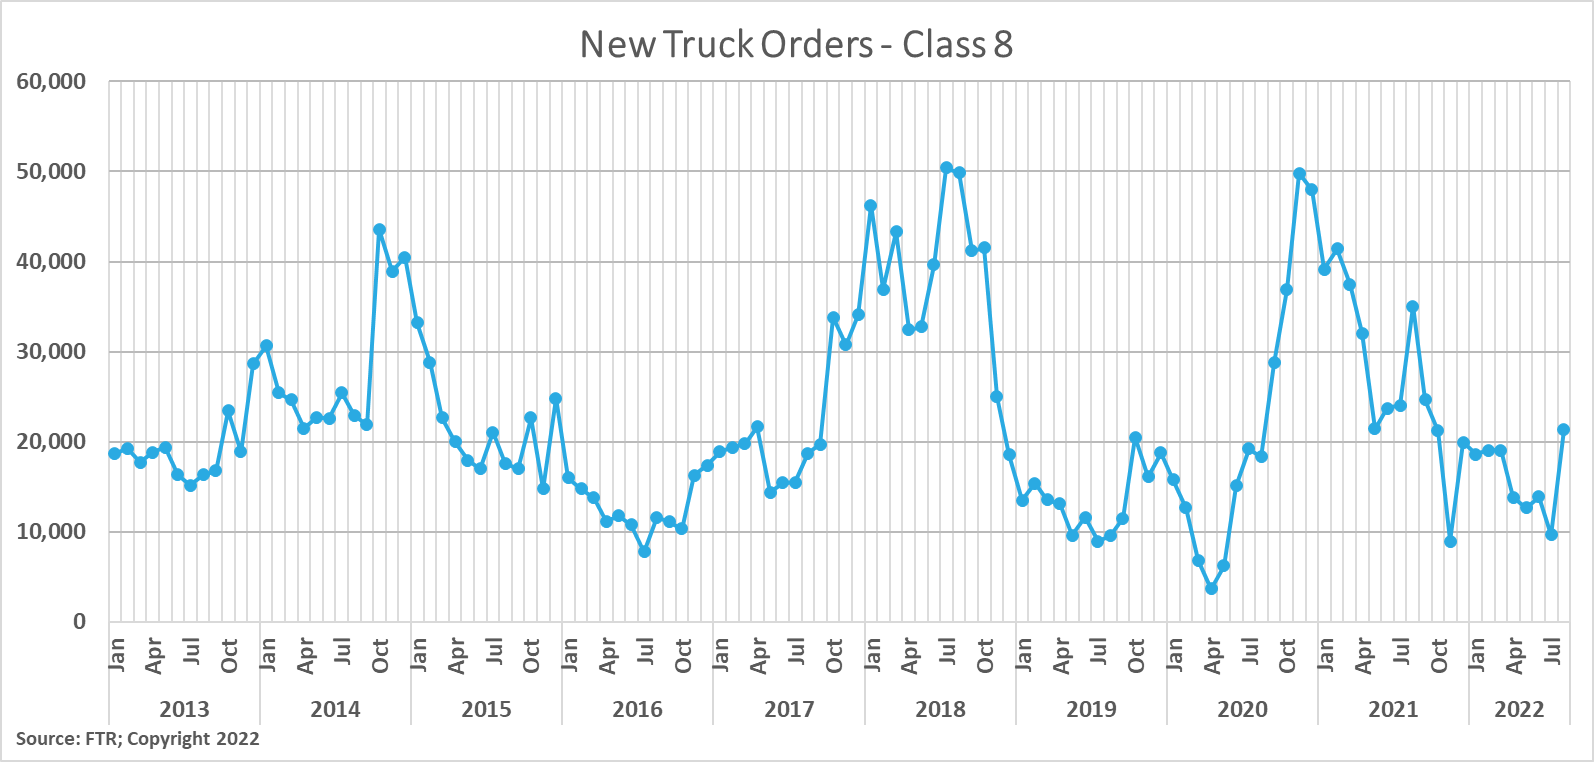
According to FTR, New Class 8 truck orders roughly doubled to 21,400 units in August as OEMs opened up orders for 2023 builds. FTR noted that demand is still significantly above production and that OEMs are controlling order levels to prevent backlogs from getting out of hand. From this perspective, we do not consider new truck orders a good indicator of carrier sentiment about future demand because many orders will be required simply to replace aging equipment. The growth in orders resulted in the average time from order to delivery increasing from 7.3 to 8.8 months.
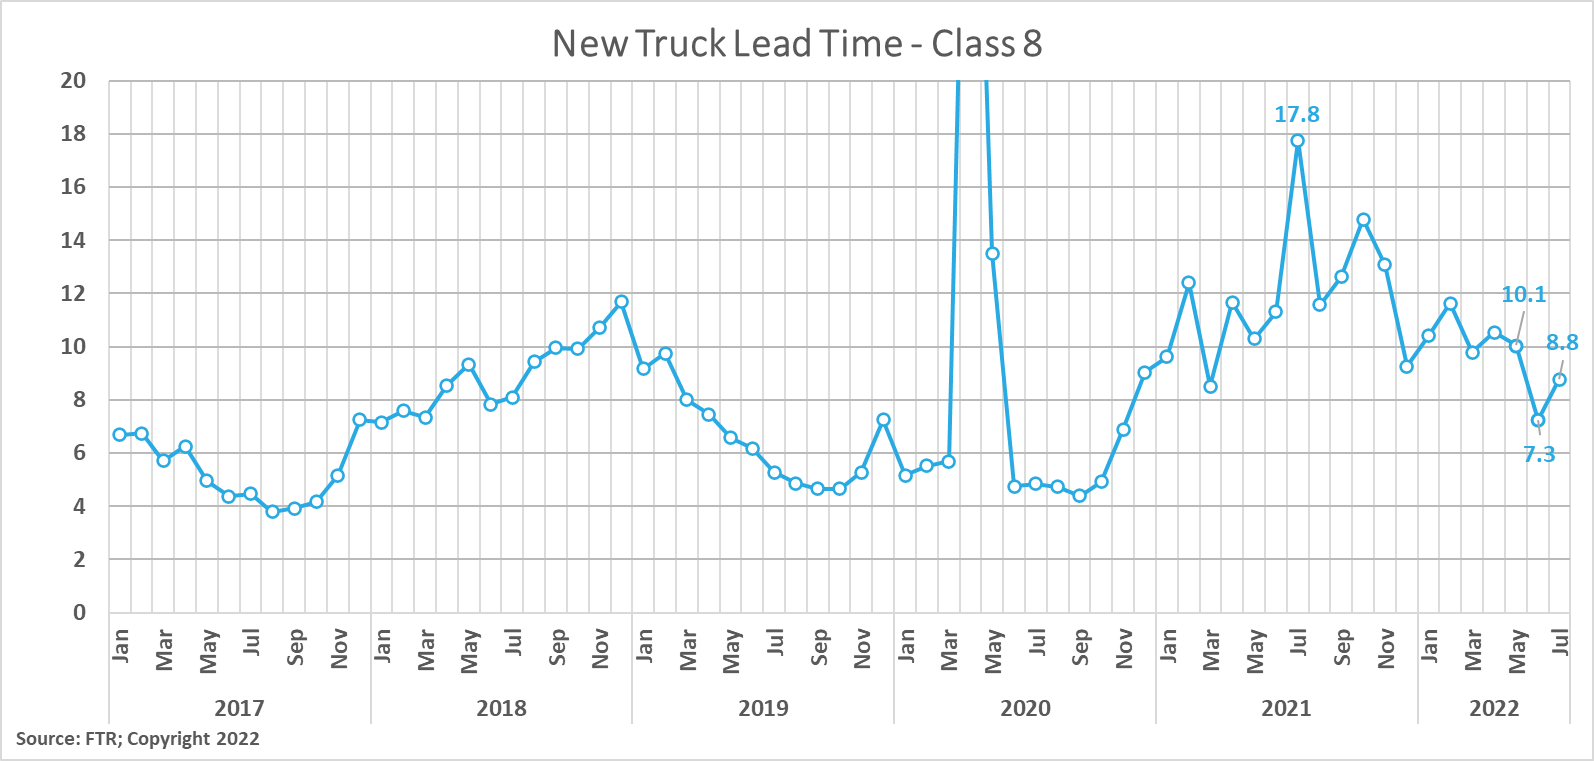 New truck lead time increased slightly from 7.3 months 8.8 months in July.
Trailers are in high demand, but OEMs are limiting orders for 2023 due to supply chain constraints. Shippers in Arrive’s network note that value drop trailers have created efficiencies at warehouses amid labor challenges and provided excess warehouse capacity to those with overstocked inventories. The ability to work ahead has mitigated unnecessary dwell times and detention payments. Additionally, carriers find efficiency gains in drop trailers, getting increased asset utilization on tractors due to spending less time waiting for freight to be loaded or unloaded. We expect this trend to continue throughout at least the remainder of the year as retail inventories remain elevated.
The outlook for demand has remained relatively stable over the past month, with most experts agreeing that freight volumes are more likely to ease than increase in the short to mid-term. Several factors are influencing this outlook, but the primary drivers of downside risk continue to be the impact of inflation and inflation mitigation tactics by the federal reserve, intended to slow down the economy. At this point, it appears volumes are unlikely to fall off a cliff — instead, they are more likely to decrease gradually.
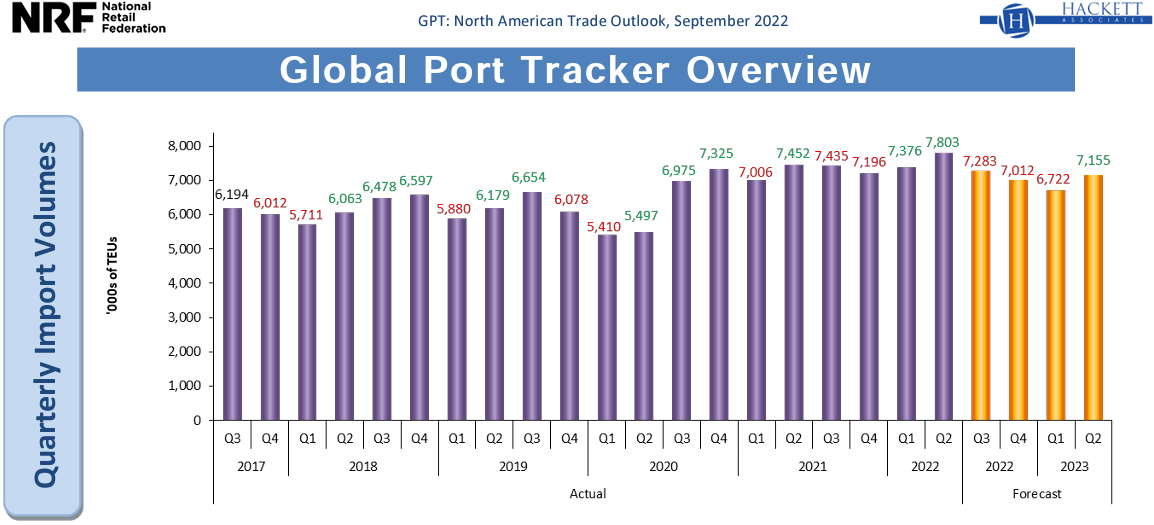
One trend that has solidified recently is a slowdown in import volumes. They were up 4.1% YTD compared to the first seven months of 2021, but in July were down nearly 1% from 2021 after falling 4% month-over-month from June. This trend certainly signals a slowdown, but it is important to note that even as import levels recede, they still remain well above pre-pandemic levels.
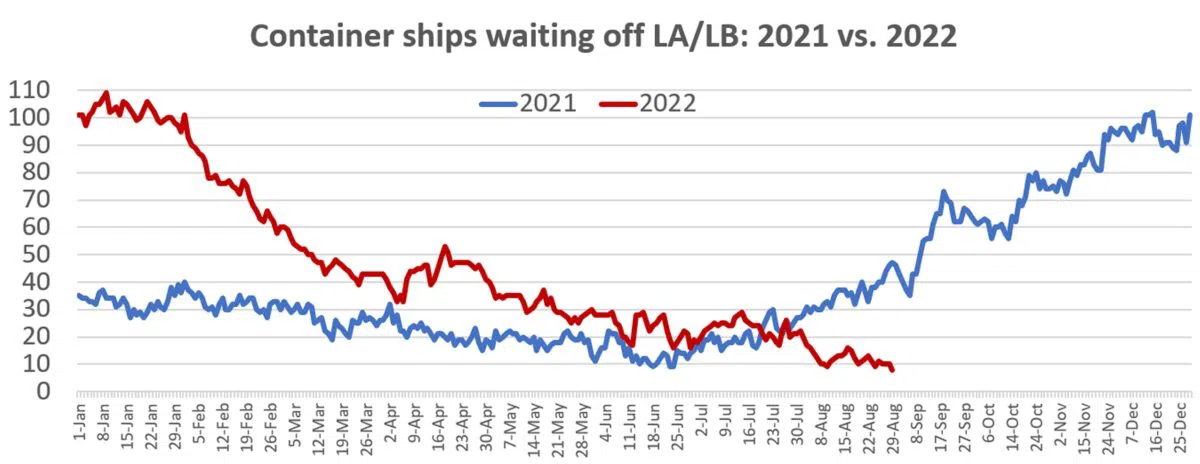
FreightWaves reports that the number of container ships waiting offshore at North American ports was relatively steady throughout August at roughly 130 ships. However, most were at East and Gulf coast ports, with just 27% at West Coast ports.
Although congestion offshore is mostly cleared at West Coast ports, there are still concerns with backups at the terminals. Downstream congestion at rail yards, retail warehouses and distribution centers is limiting the flow of freight inland. In fact, nearly half of the 60,000+ loaded containers were waiting at ports to be moved onto railcars. Shippers have welcomed these rail delays in favor of over-the-road trucking to move freight inland because it’s allowing time for them to clear storage space to receive new inventory. Tender rejection rates out of Southern California are extremely low for this time of year, and the preference for rail transport is the main reason.
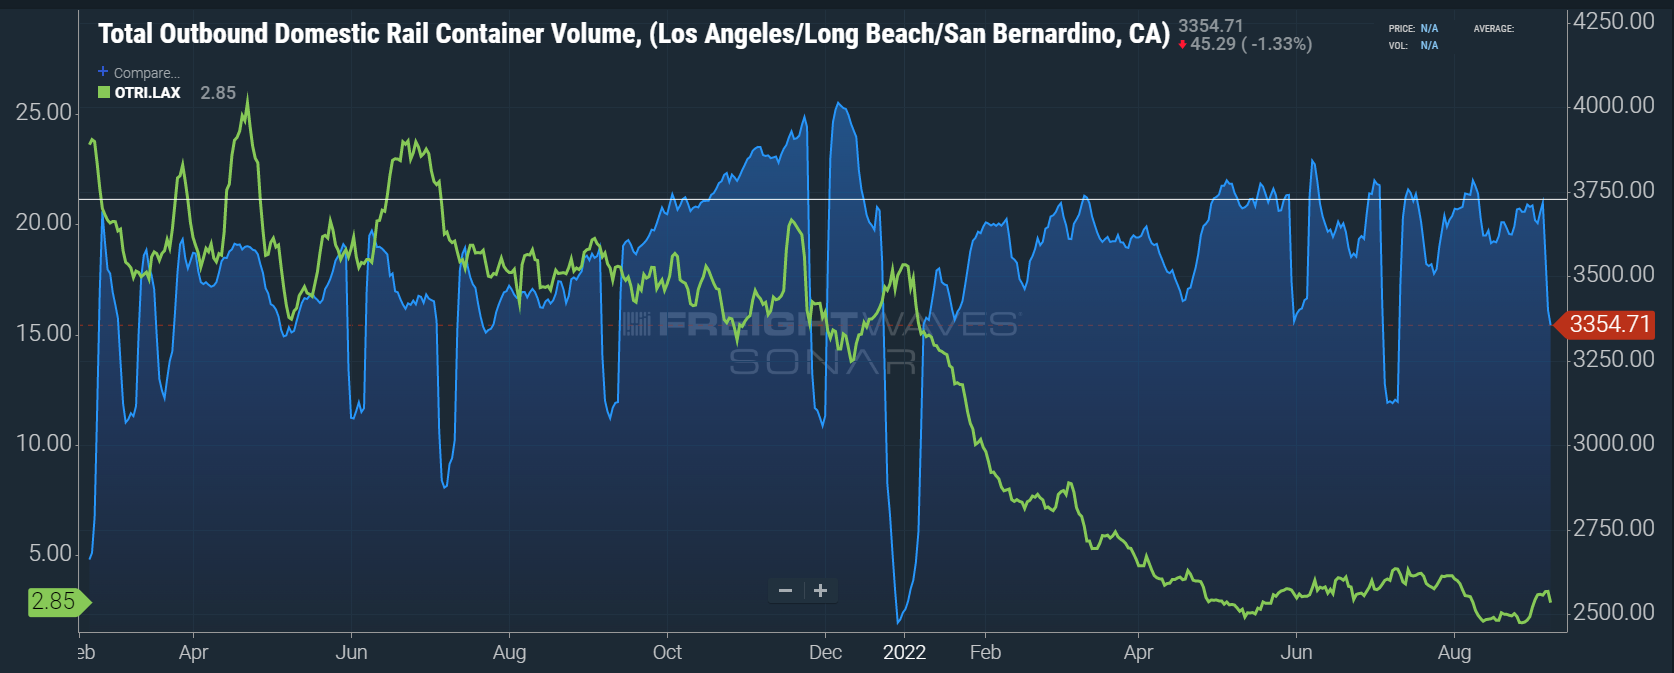 Elevated rail volumes out of Southern California are leading to easing conditions in over the road transportation for shippers.
We still believe that growing congestion at major rail yards is a potential concern for shippers who wait too long to access their cargo before the holiday season. A sudden increase in urgency could lead to a demand surge in these markets, creating regional challenges with capacity and poor equipment utilization. The looming potential of a major rail strike only compounds concerns about backups at rail terminals across the country.
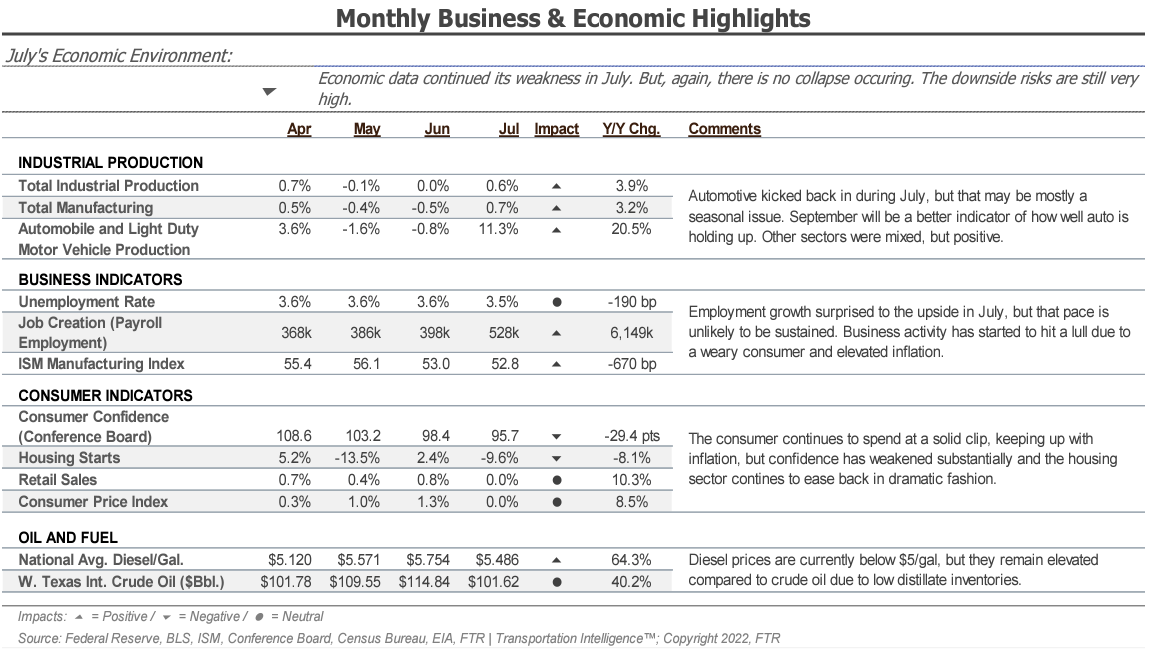
Industrial production and manufacturing maintained strength, but rising interest rates have led to a rapid housing and construction activity slow down. This trend is the primary cause for concern as it relates to future truckload demand. However, current conditions are still better than pre-pandemic levels, supporting our outlook for more gradual slowdowns.
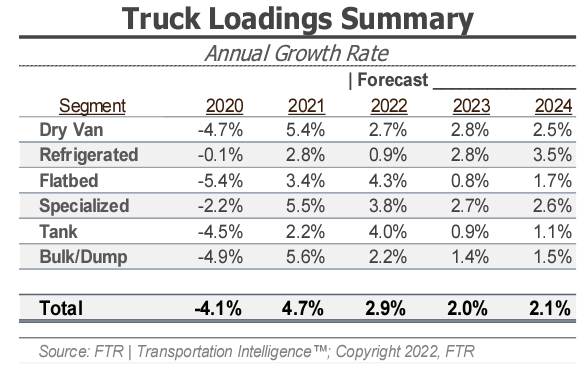
FTR’s latest truck loadings forecast showed a 2.9% year-over-year increase in 2022, down from 3.6% in the prior forecast. The 2023 forecast remains unchanged, showing growth at a rate of 2.0% year-over-year.
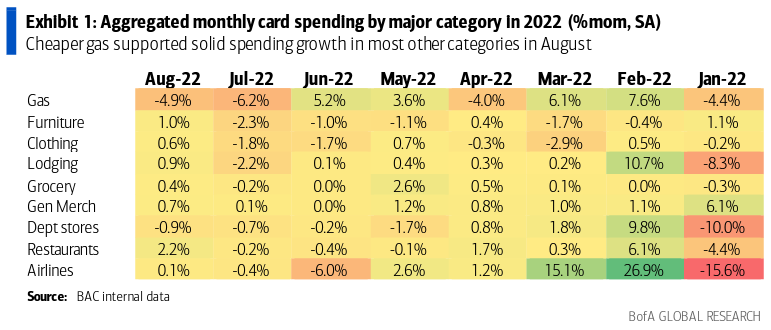
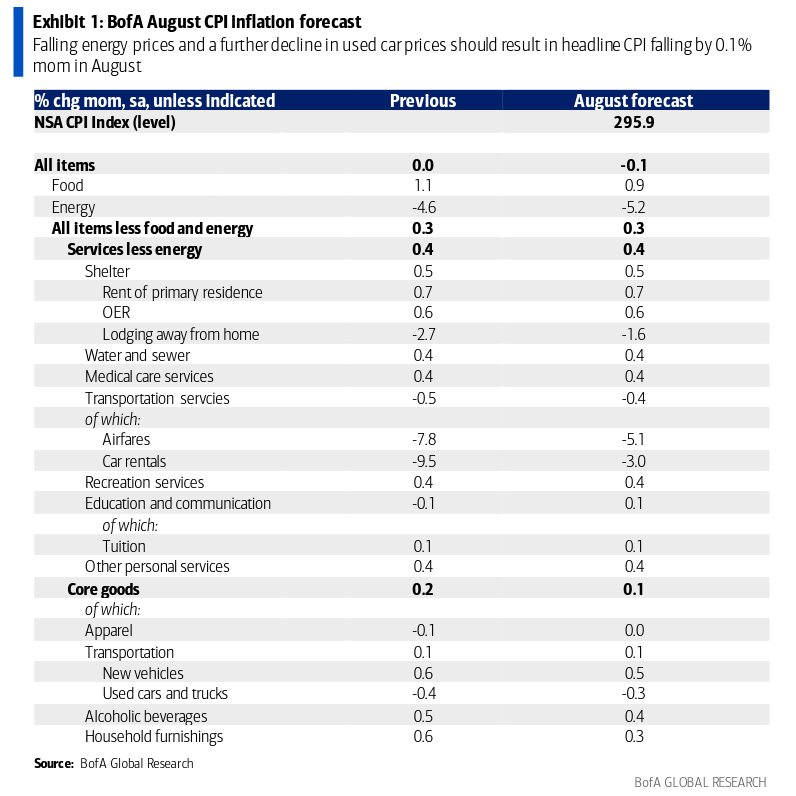
CPI data for August has not yet been released at the time of this report. However, Bank of America is forecasting the first sequential decline in headline CPI since May 2020 and a .3% increase in core CPI. This would put headline and core CPI at 8.2% and 6.0%, respectively. Energy prices are expected to fall an additional 5.2% after falling 4.6% the previous month. Food, on the other hand, will see slight price increases.
Consumer spending trends continued to improve as lower gas prices led to solid spending growth in most other categories. Total card spending per household was up 5% year-over-year in August, offering reassurance that consumers remain confident.