"*" indicates required fields
"*" indicates required fields
"*" indicates required fields

This document contains our comprehensive outlook for national dry van and reefer truckload rates for November 2022 through December 2023. The Arrive Insights™ team generated this forecast through a combination of extensive historical research and output from the predictive models built into ARRIVEnow, our proprietary technology platform.
Successfully navigating freight market ebbs and flows begins with a basic understanding of the relationship between rates and the unique components of truckload supply and demand. Simply put, high or increasing demand and tight capacity will cause upward rate pressure, whereas low or easing demand and ample available capacity will drive rates down.
By tracking directional trends for truckload demand (volume) and available capacity (trucks) in the market at any given time, we can predict rate trends with a high degree of accuracy and consistency. With that, we present to you our rate forecast for the year ahead.
Overall, rate movements have aligned with the forecast we released in October 2022. Although the market experienced more volatility than expected during the 2022 holiday season and early January 2023, conditions have fallen in line with where we projected they would be late in Q1 2023. Downward pressure on rates persists as the economy and truckload demand normalize toward pre-pandemic levels. Additionally, surplus capacity accumulated over the last few years should drive a prolonged period of spot market equilibrium and deflationary contract rates as the gap between the two closes.
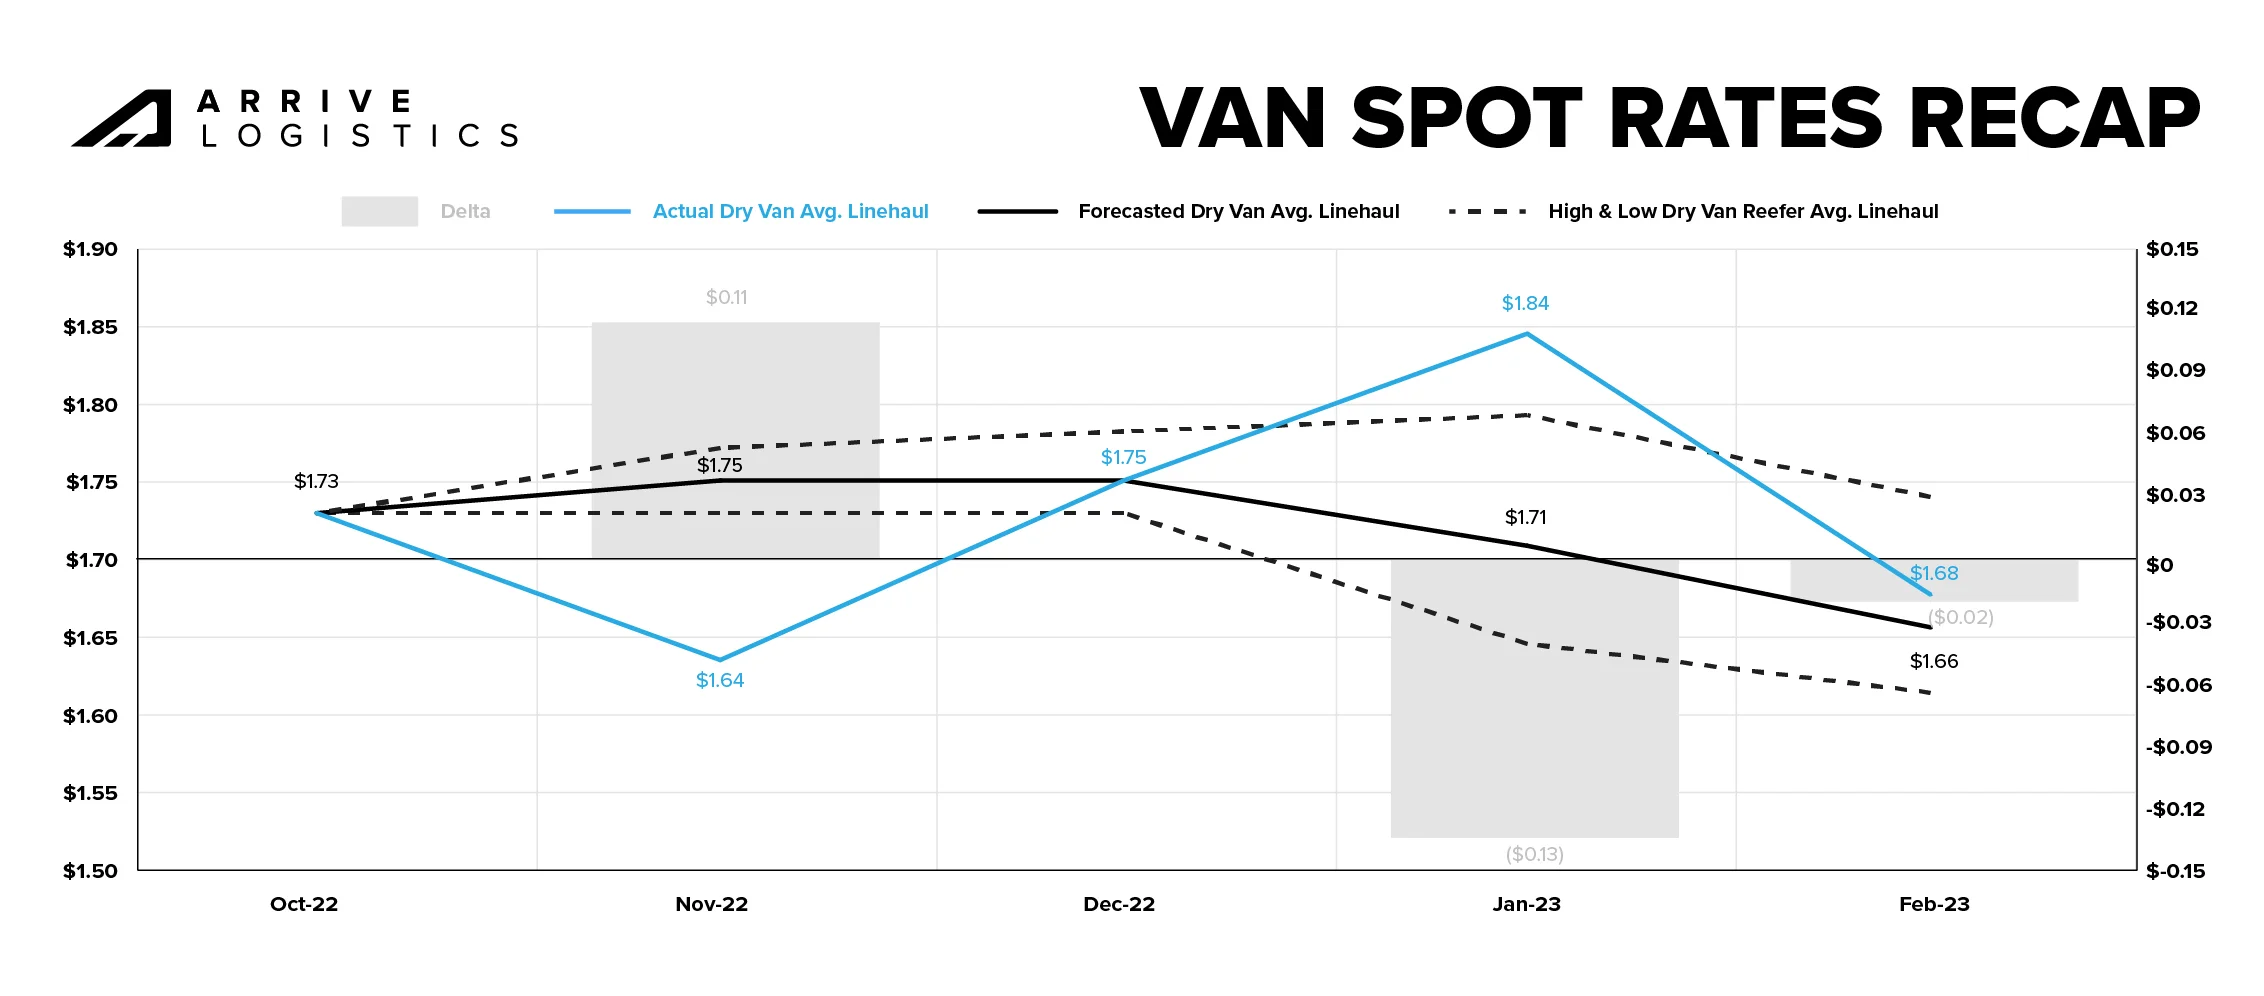
November van spot rates declined rapidly and landed short of expectations due to reduced retail demand and excess inventory buildup ahead of the holiday season. However, in December, rates rebounded as expected, thanks to a demand surge and seasonal capacity constraints caused by the holidays and winter weather disruptions.
The market disruption persisted longer than predicted, leading to a slight deviation from our forecast in January. However, rates quickly fell back in line with expectations later in January and into February, so the forecast error for February was just $0.02 off of our initial projections.
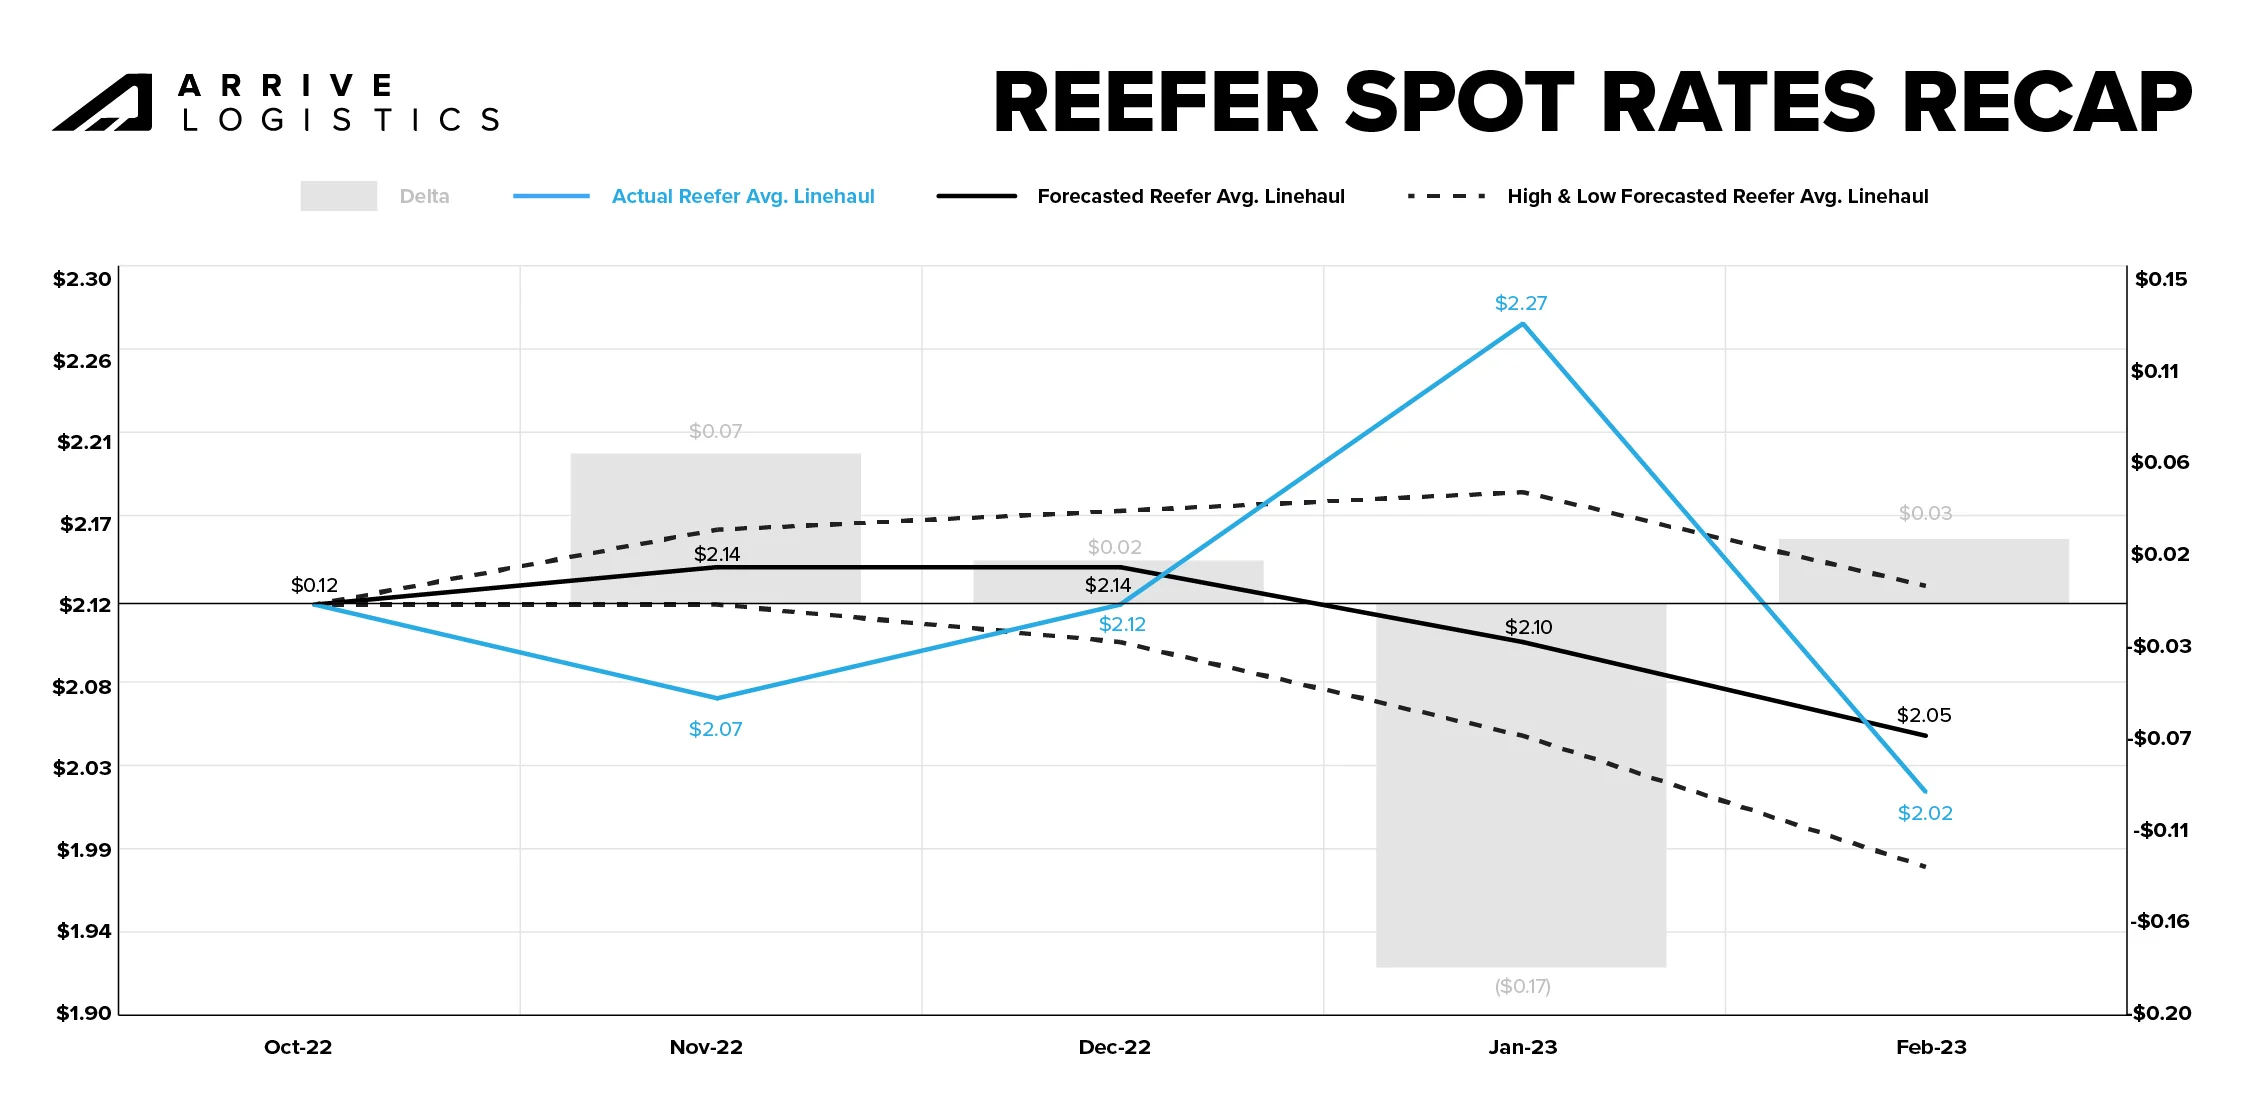
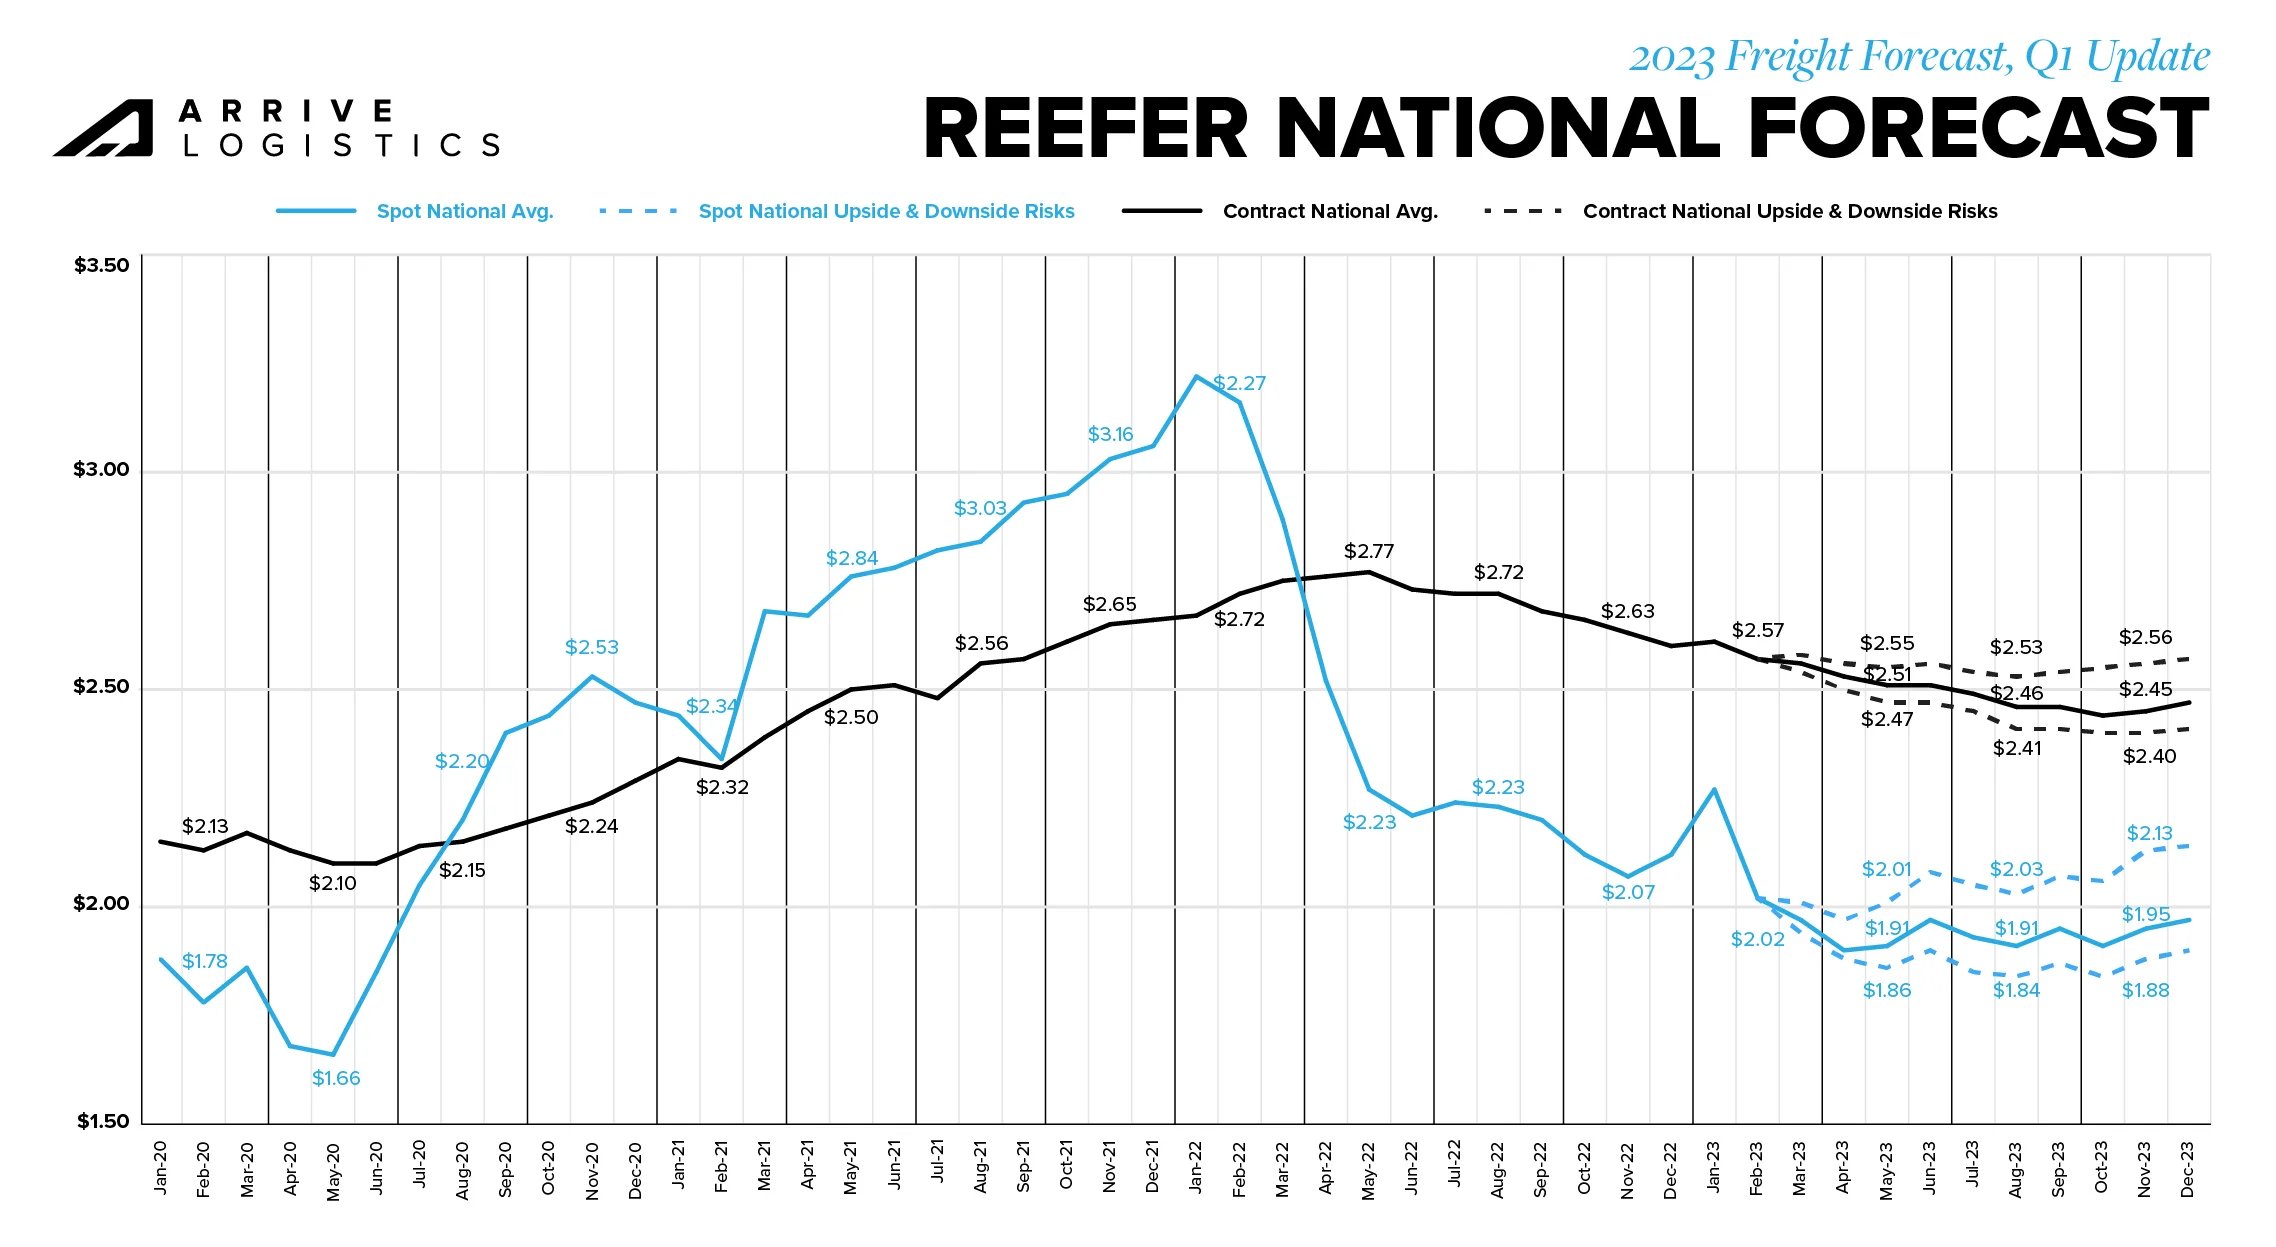
Reefer spot rates followed a similar trend to van spot rates for the same period. Following a slow November, December rates aligned with our forecast once extreme weather and seasonal capacity constraints set in around the holidays. The disruption persisted into January, driving a slight deviation from our forecast during that time.
The gradual rate movement we predicted for January and February happened significantly faster than anticipated, bringing rates back in line with our October 2022 projections and creating a nominal forecast error of just $0.03. Fuel also had a similar impact on reefer spot rates as van spot rates.
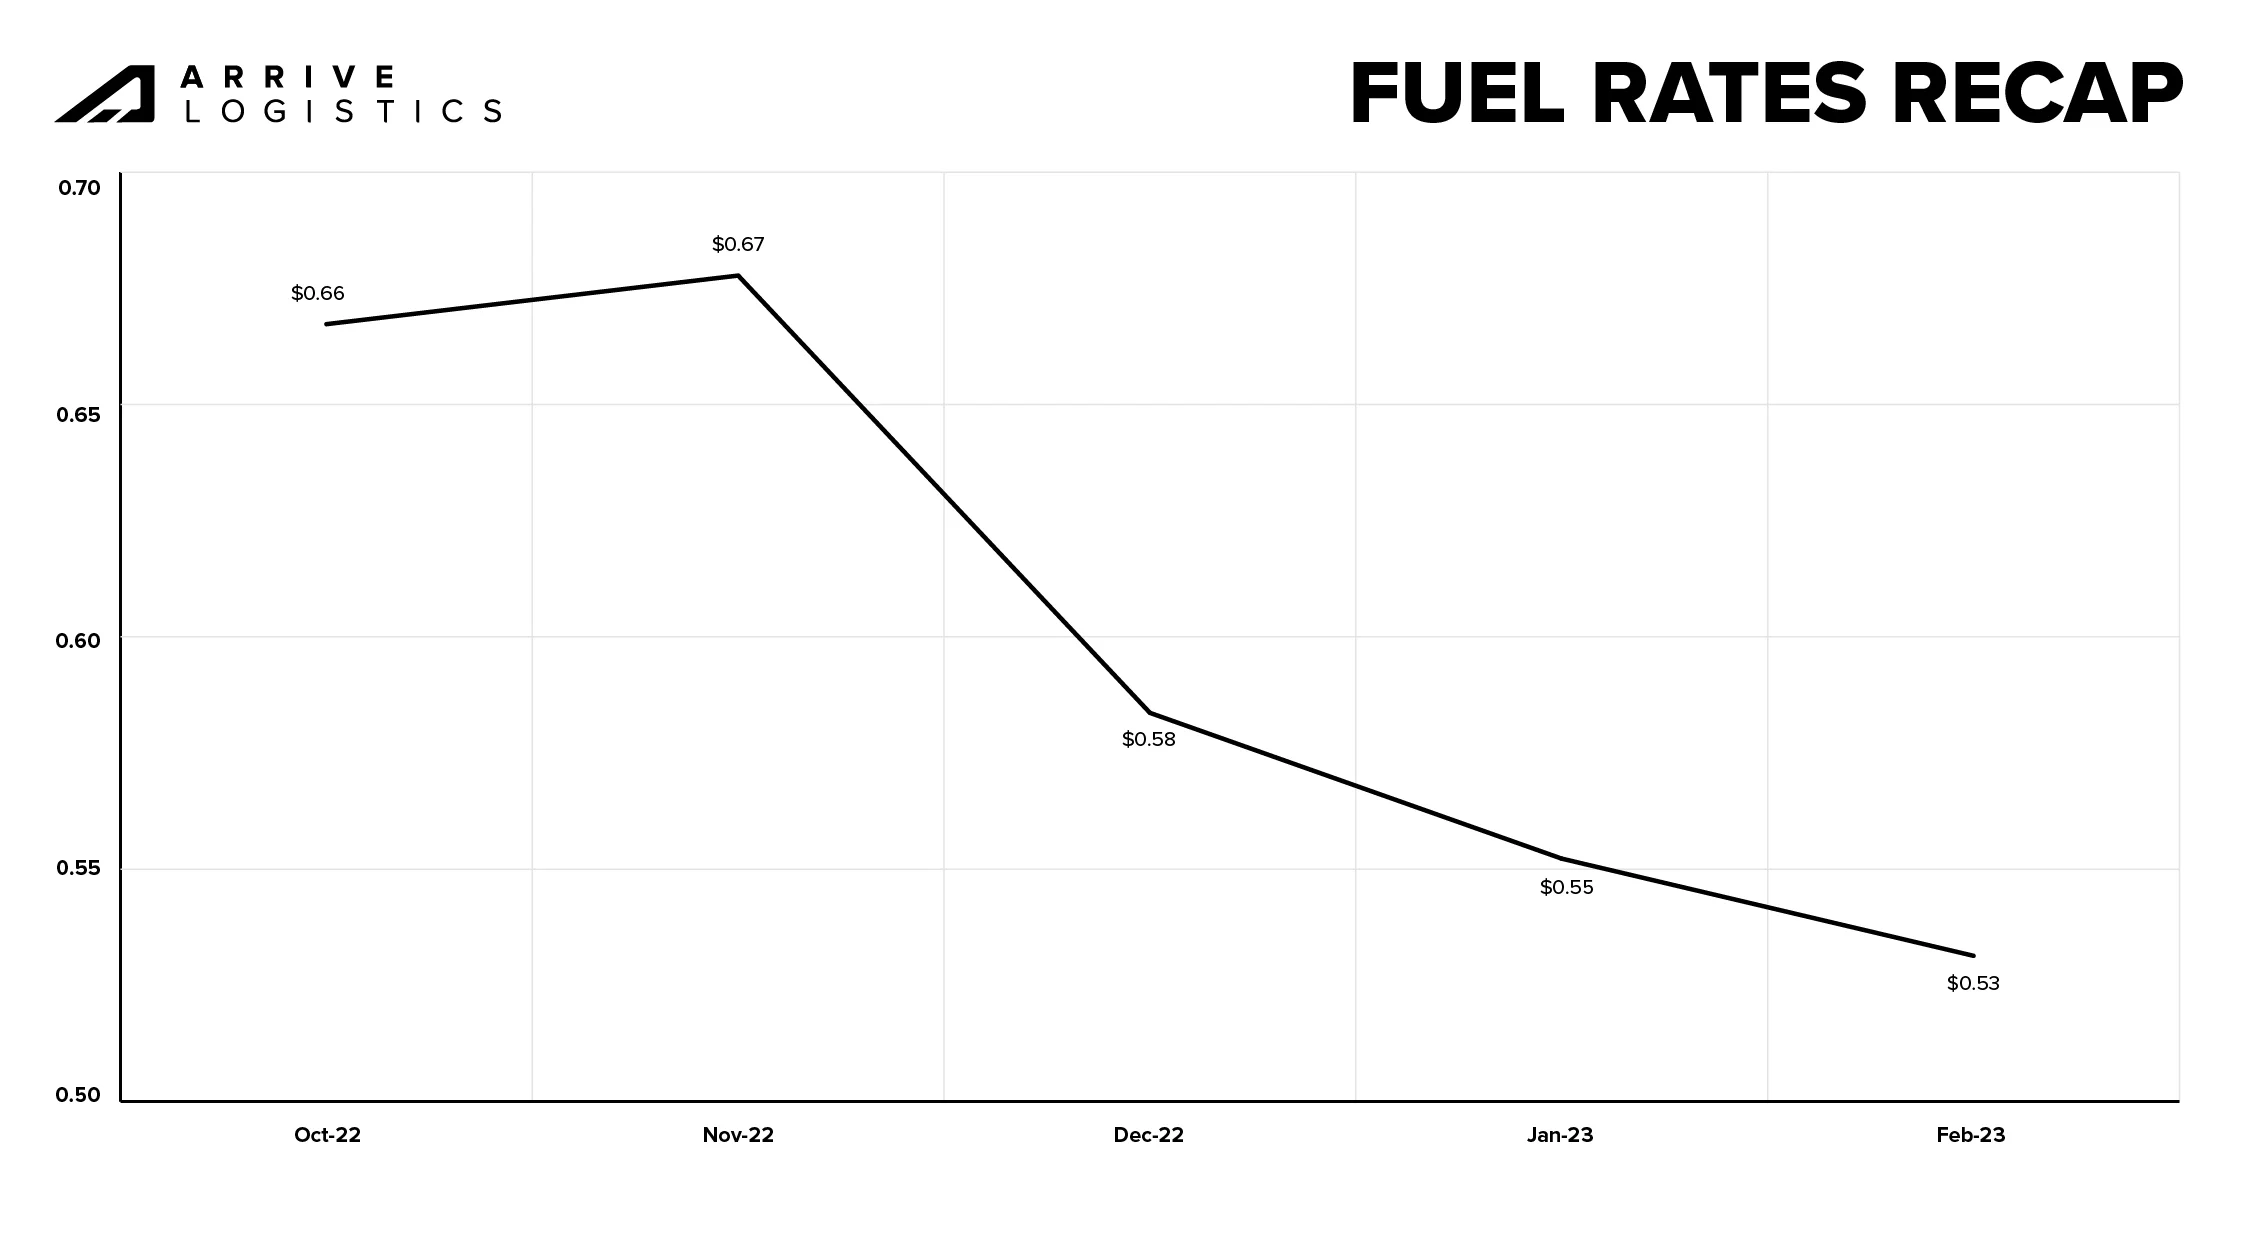
Spot rates are typically negotiated as all-in rates, so rapid fuel price fluctuations can contribute to forecast errors. For example, the significant $0.14 per mile decline in the average fuel surcharge from November 2022 to February 2023 likely led to temporary volatility in our forecast. Fuel prices have since stabilized, resulting in rates that align closely with our original projections.
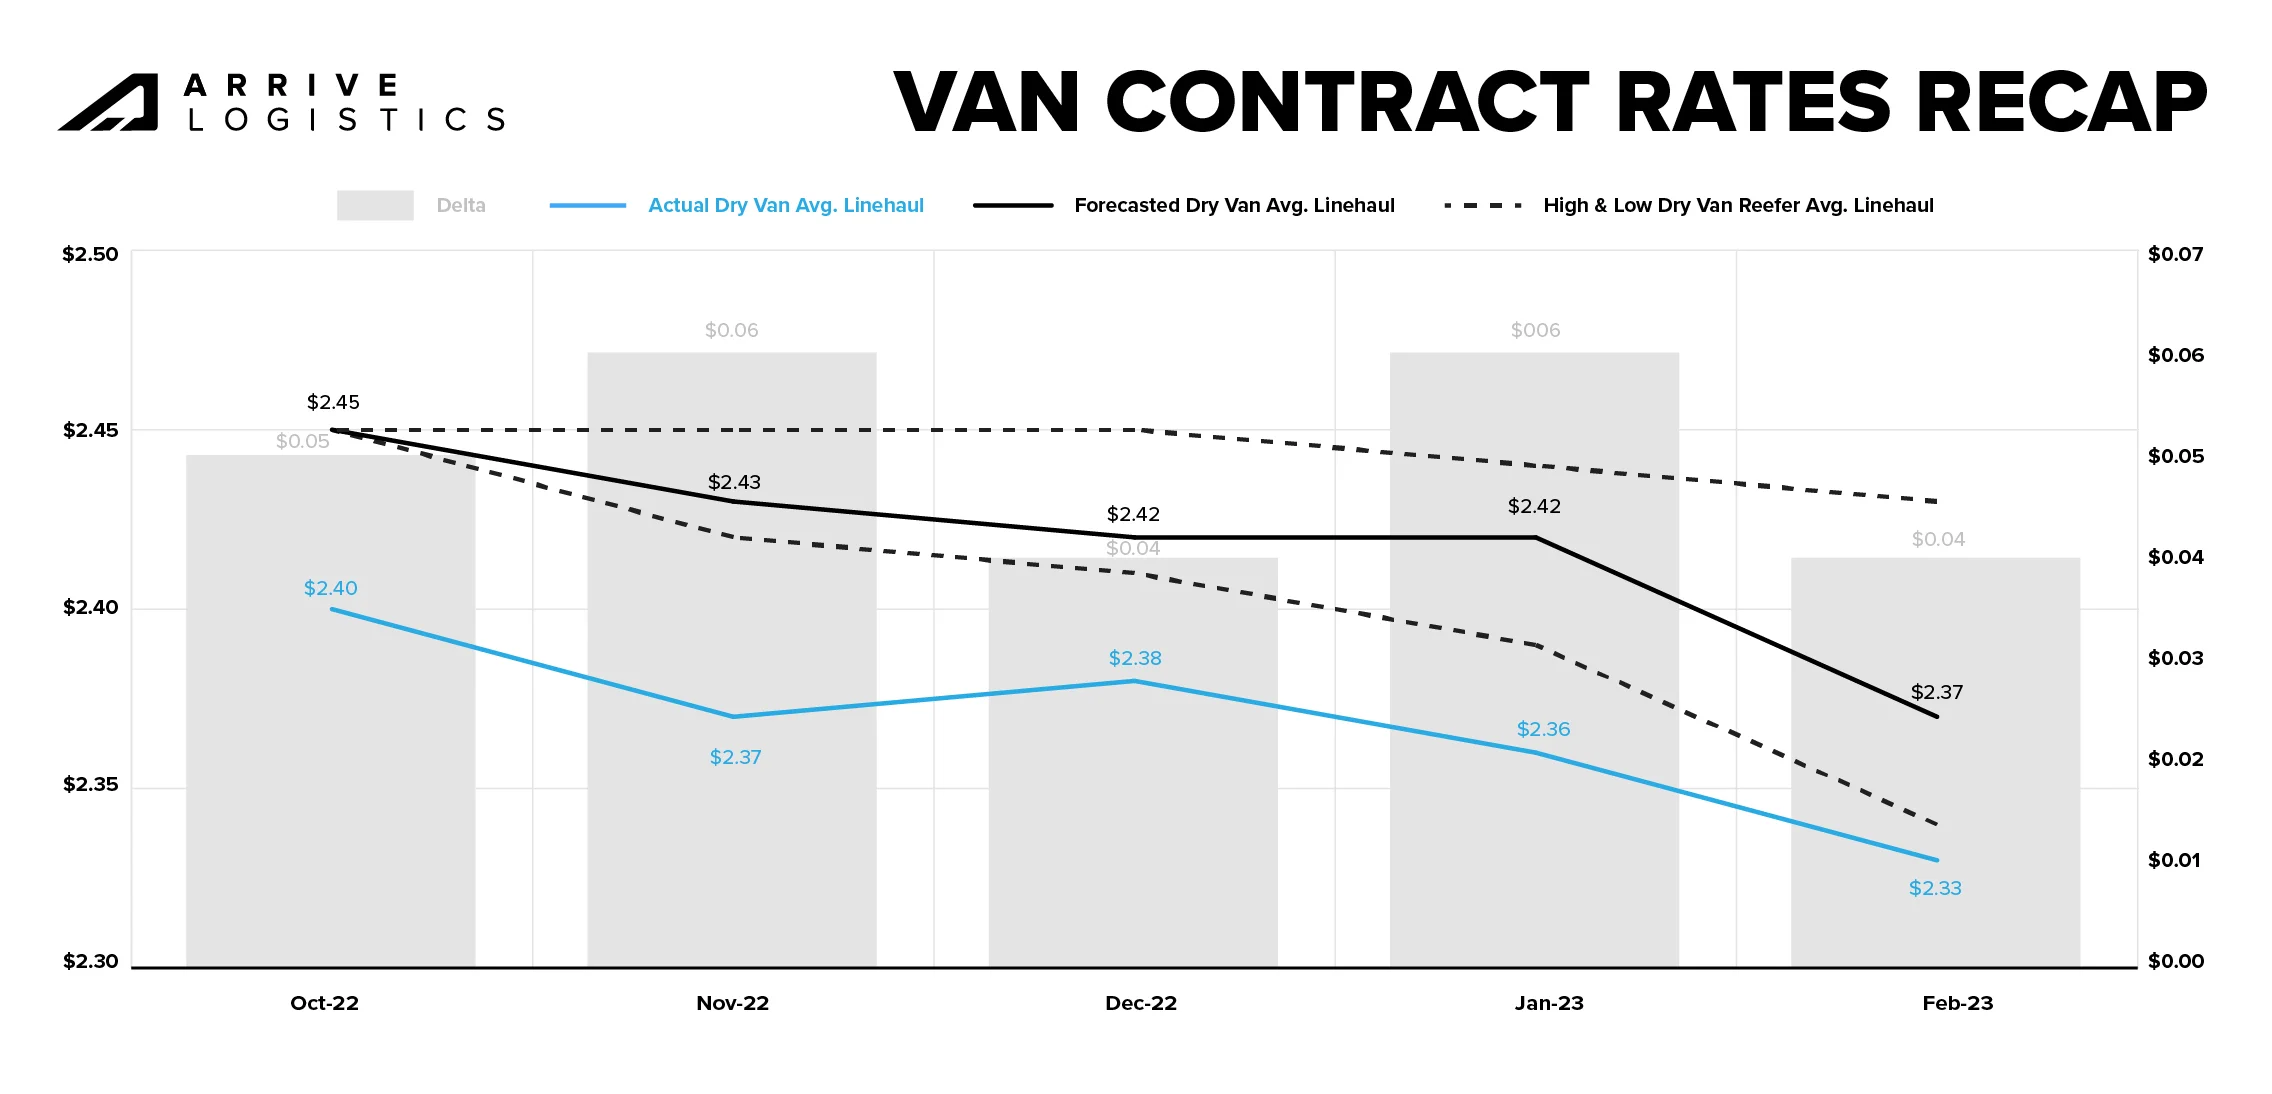
At the beginning of November 2022, DAT reported the October van contract rate to be $2.45 per mile, excluding fuel. As the month went on, that number adjusted to $2.40 per mile, excluding fuel. Though such adjustments are not uncommon in DAT data, ones of this size are, and it shifted our contract rate baseline by $0.05 before the forecast even went live.
With that in mind, we recommend reviewing the monthly predicted rate movements when using this forecast for planning purposes. For example, for October 2022 to February 2023, we forecasted contract rates, excluding fuel, to fall between $0.02 and $0.11 per mile, with a decline of $0.08 per mile being the most likely scenario. The actual rate decline was $0.07 per mile, meaning our forecast was within $0.01 per mile of actual contract rate movements.
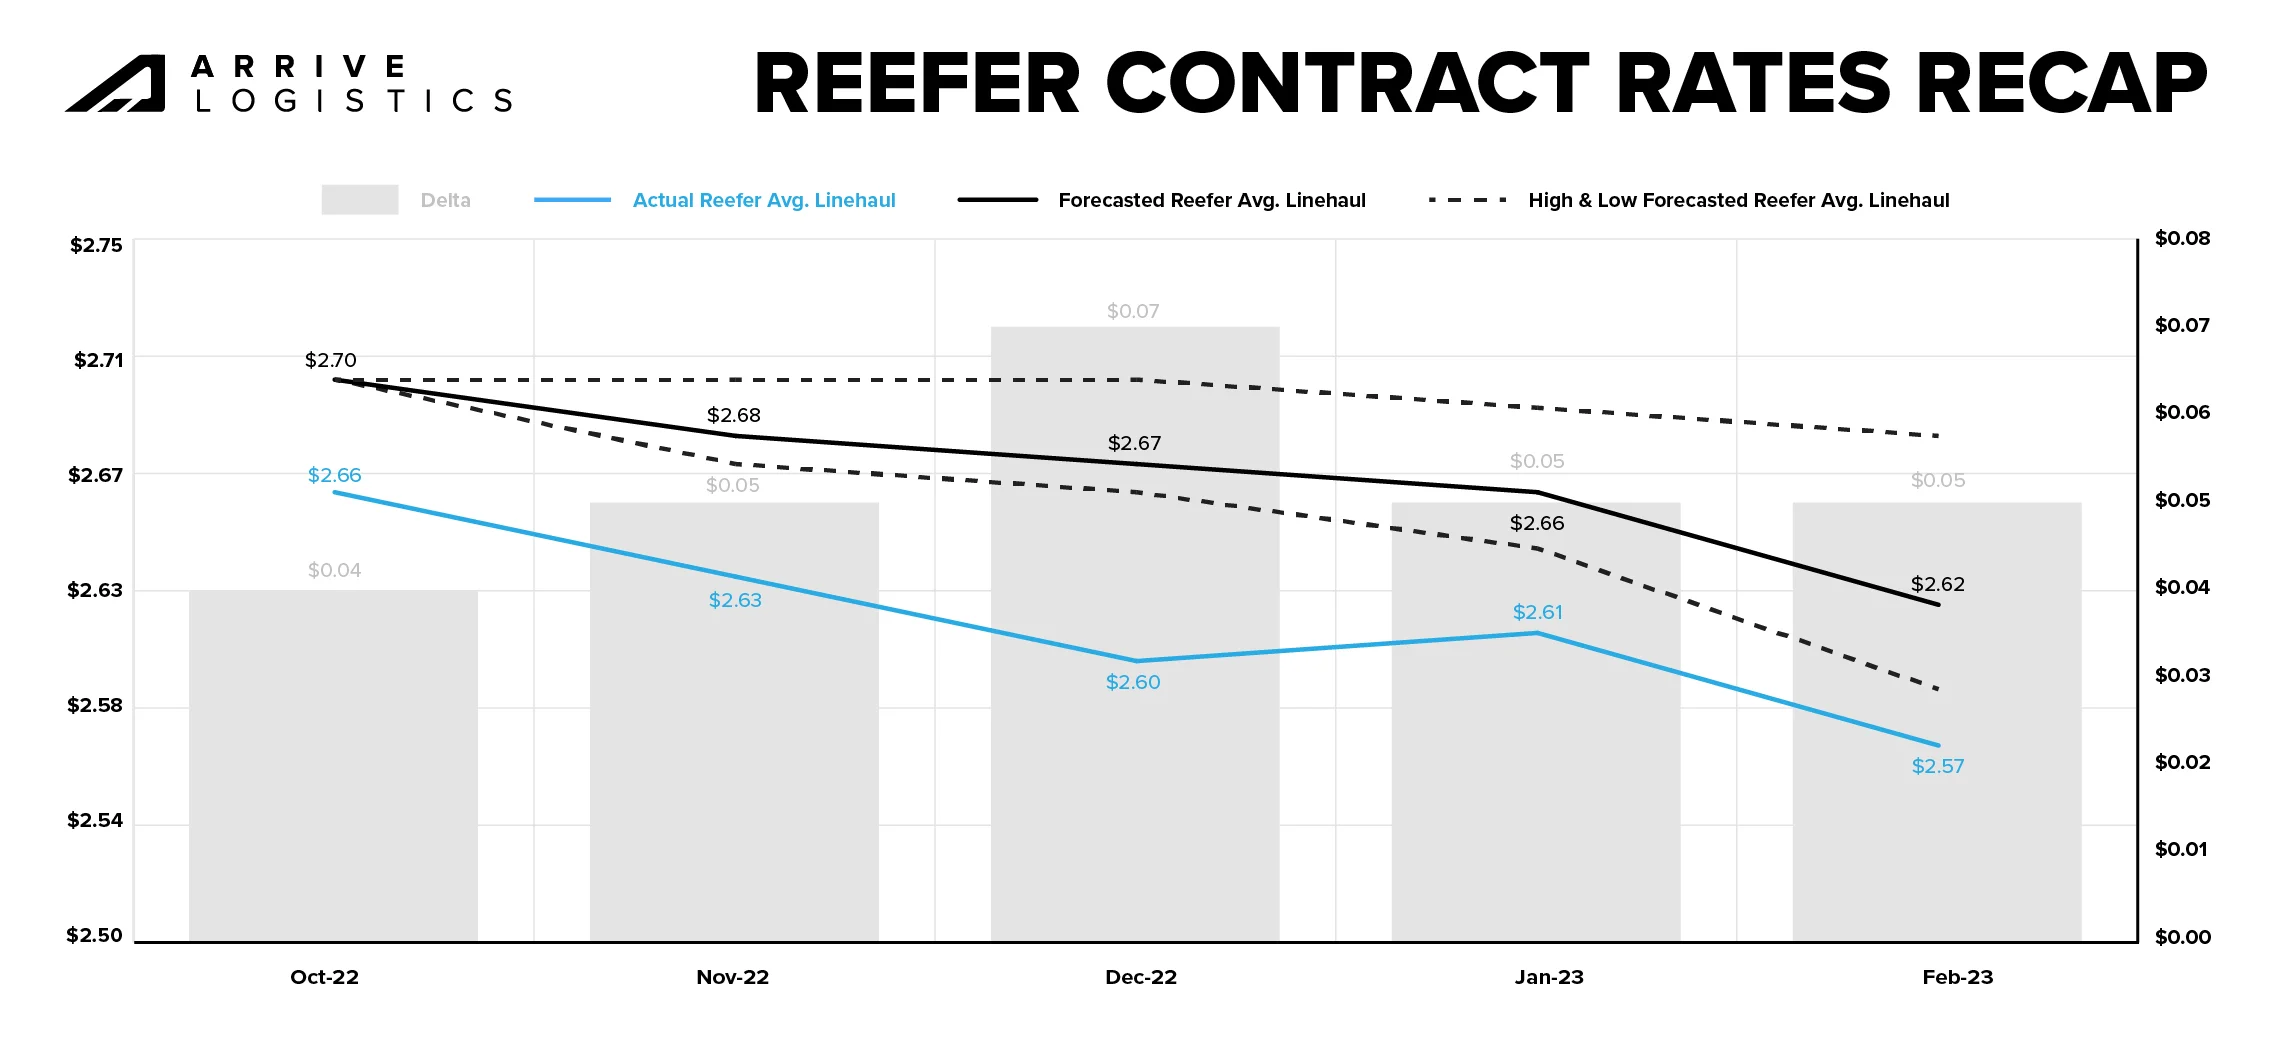
DAT reefer contract rate data showed a similar adjustment to van contract rates in October 2022. Thus, the same baseline adjustment rule applies here. From October to February, we forecasted contract rates, excluding fuel, to fall between $0.02 and $0.11 per mile, with a decline of $0.08 per mile being our most likely scenario. The actual rate decline was $0.09 per mile, meaning our forecasted rate movement was within $0.01 per mile of actual contract rate movements.
We expect spot rates to remain relatively stable as contract rates continue normalizing and the gap between the two gradually closes throughout the year. Demand will likely outpace capacity exiting the market in the short term, so strong routing guide compliance should continue. However, current conditions will lead to carriers right-sizing their fleets in response to downshifts in demand, which may drive enough capacity out of the market that it becomes vulnerable to widespread severe weather, demand surges or other disruptive events.
Capacity will continue to be established on contract freight, and shippers can expect ongoing strong routing guide performance. Significant capacity was added to the market during the last inflationary rate cycle, with total employment in long-haul trucking recently reaching an all-time high. Record numbers of owner-operators and small carriers are shutting down; however, market capacity remains ample as many take company jobs with larger assets rather than leaving the industry entirely. Strong routing guide compliance through the summer 2022 peak season and at the onset of Q4 2022 provided additional confidence that capacity is sufficient to support current demand. 2023 RFP season awards are expected to be smaller than a year ago, leaving many carriers without enough freight to support current staffing levels — this could be the first sign of declining trucking employment growth.
Overall freight tonnage will likely decline further as economic conditions normalize toward pre-pandemic levels. Current truckload demand is healthy compared to historical norms, but strong routing guide performance continues to drive significant spot market demand declines. Rising interest rates have already slowed housing markets, which, in turn, means fewer goods purchases and slowing demand. Ongoing inflation will likely continue to drive down consumer spending on goods. Declining manufacturing orders and weak retail import forecasts will increase downside risk for the demand outlook.

This forecast outlines what we believe will be the most likely scenario given the information available at the time of writing; however, unforeseen events, including but not limited to the following, may cause market volatility that impacts these projections.
The Russia/Ukraine conflict significantly impacted freight markets in 2022 and remains a downside risk in 2023. Similarly, tensions between China and Taiwan may impact Asia-U.S. relations and trade, including Taiwan’s prominent semiconductor production.
We accounted for current economic conditions and the prospect of a late 2023 recession in this forecast. However, conditions may worsen faster than expected, resulting in declining trucking demand due to dwindling consumer demand and manufacturing pullbacks.
Severe weather is a frequent source of freight market disruption. Though winter storms tend to have the greatest impact, healthy Q1 capacity should help mitigate any significant issues if major weather events occur.
Spot rates have fallen below public truckload carriers’ operating cost per mile. When this occurs, it usually isn’t long before spot rates rebound or experience some upward pressure because rates can only fall so far before carriers start to lose money and decide to sit out or leave the market entirely. This scenario creates a floor for rates and is why our forecasted spot rates typically trend to the downside.
Rapid changes in fuel surcharges can create complexities in measuring forecast error. They can also create different behavioral profiles for shippers and carriers in the marketplace. For example, rapid declines in fuel costs create more favorable conditions for carriers and alleviate pressure on shippers looking for cost reductions. Historically fuel prices have remained relatively stable, but over the past year, we have redefined what fuel price volatility looks like.
The national average spot rate per mile aggregates the weekly market-to-market, 7-day spot rates on lanes of 500 miles or more. The thresholds on market-to-market and 7-days help ensure we are using lanes of higher density, which are more representative of the true cost of most lanes. Additionally, the minimum threshold of 500 miles eliminates the inclusion of short hauls, which could inflate the index based on the rate per mile.
The national average contract rate per mile is sourced from DAT data and underwent no additional aggregation.
"*" indicates required fields

Matt Pyatt is the Chief Executive Officer of Arrive Logistics. He co-founded Arrive with President Eric Dunigan in 2014 after building his career at Command Transportation. As CEO, he is responsible for overseeing the company’s financial health, strategic vision and culture, as well as building a scalable leadership team to support Arrive’s growth.
"*" indicates required fields
"*" indicates required fields
Please have the following info ready to complete registration
Fraud Prevention
Freight fraud continues to impact our industry. We encourage shippers and carriers to reach out to Arrive immediately if there is ever a shipment in question that may be subject to fraud (including fictitious actors and websites). Arrive will not ask you to pay upfront for any dedicated lane or committed capacity program. If the offer you are receiving sounds too good to be true or unrealistic, it may be fraud. Arrive Logistics recommends verifying all communications come from our registered email domain is @arrivelogistics.com and notes that access via VPN or Proxy is prohibited on Arrive systems. Our 24/7 phone number is 888-861-0650 and our leadership team can also be reached at feedback@arrivelogistics.
Use of Cookies
We use cookies to enhance your browsing experience, serve personalized ads or content, and analyze site traffic. By continuing to use this website, you acknowledge and consent to our use of cookies as detailed in our privacy policy.
If you’re not an Arrive customer, please join our network to access the portal.
"*" indicates required fields

Scott Sandager is the Chief Administrative Officer at Arrive Logistics. He joined Arrive in 2018, bringing over 14 years of logistics and brokerage experience, with expertise in project and change management, organizational design, talent development and customer satisfaction. Scott previously held many diverse roles of increasing responsibility with AFN, a Chicago-based freight brokerage.

Eric Dunigan is the President of Arrive Logistics. He began his career at Command Transportation before co-founding Arrive with Matt Pyatt in 2014. As president, he is responsible for driving revenue and growth, as well as leading the Strategic Partnerships team — a veteran group of supply chain experts who work with Arrive’s customers to reimagine their shipping strategy.
"*" indicates required fields

David Spencer is the Vice President of Market Intelligence at Arrive Logistics. David joined Arrive in 2017 after spending six years at AFN focused on business intelligence. His department provides critical market data and expert analysis to internal teams and publishes monthly market updates for shippers and carriers under the Arrive Insights banner.

Andrew Clarke is Board Chairman for Global Critical and DCLI, Inc., and a board member for Arrive Logistics and Element Fleet Management Corp. His 20 years of global transportation and logistics experience include time as CFO of C.H. Robinson, CEO of Panther Expedited Services, Inc. and SVP and CFO roles at Forward Air Corporation.

Dean Croke is a Market Analyst at DAT Solutions, where he focuses on freight market intelligence and data analytics. His 35 years of experience with data analytics, transportation, supply chain management, mining and insurance risk management include time as co-founder of FleetRisk Advisors and in a number of other high-level roles with FreightWaves, Spireon, Lancer Insurance, Omnitracs Analytics (formerly Qualcomm) and more.

Asanka Jayasuriya is the CTO at 8VC. He is an accomplished engineering and product leader with 20+ years of experience in the cloud. He has a strong background in enterprise SaaS, PLG products, infrastructure, and security. Notably, he served as CTO and SVP of Engineering at SailPoint, leading their successful transition to the cloud and successful exit event. He also held senior leadership roles at InVision, Atlassian, and Amazon, driving growth, operational excellence, and innovation. At 8VC, Asanka works with the entrepreneurs and leaders in our portfolio as a virtual CTO supporting their growth.

Chad Eichelberger is the President of Reliance Partners. Since 2015, he’s leveraged his extensive experience in risk management, compliance, best practices and contracts to lead the company’s logistics and truck insurance strategy and operations. Chad was previously the President of Access America Transport, where he led the company from $8M to over $600M in revenue.

Barry Conlon is the CEO and founder of Overhaul, the global leader in active supply chain risk management and intelligence. With a remarkable career spanning over 30 years in supply chain security, he is widely regarded as a trailblazer in modern-day supply chain security standards and best practices.

As VP and Senior Analyst at ACT Research, Tim analyzes commercial vehicle demand and alternative powertrain development (i.e. electrification), and authors the ACT Freight Forecast, U.S. Rate and Volume Outlook. He previously spent fifteen years in equity research focused primarily on the transportation, machinery, and automotive industries, and co-founded leading equity research firm Wolfe Research.
"*" indicates required fields