


Truckload demand has been relatively lackluster in the first half of Q4. However, this lull between the end of Q3 and the holiday peak season ramp-up is not unusual by seasonal standards.
In mid-November, most signs indicate reefer equipment will be challenging through the year-end as demand associated with holiday meals sets in. Van freight has been free from significant disruptions thus far, and with most holiday retail inventory already in place, capacity challenges are expected to be limited to the weeks leading up to and following Christmas.
The DAT reports exclusively on spot load trends and noted that posts were down for the second straight month, falling 7.1% from September to October after decreasing 12.3% from August to September. Annual comps still showed a year-over-year decline, with spot load posts improving slightly from -43.4% in September to -41.6% in October.
Of additional note, spot load posts were up 9.5% from the last week of October to the first week of November, highlighting the growing risk of volatility to seasonal demand as the quarter progresses.
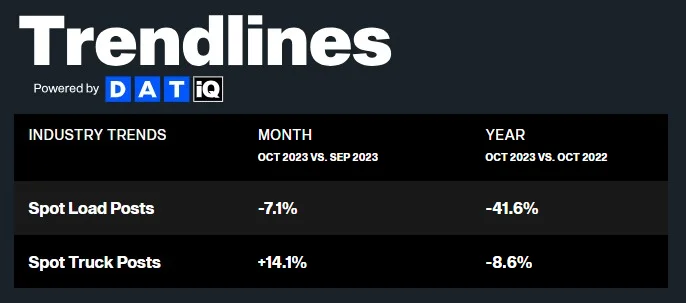 Figure 1: DAT Trendlines
The FreightWaves SONAR Outbound Tender Volume Index (OTVI), which measures contract tender volumes across all modes, was down 3.1% year-over-year, or 1.4% when measuring accepted volumes after the significant tender rejection rate decline.
Accepted volumes were down 2.6% year-over-year, with accepted dry van tenders down 1.5% and accepted reefer tenders down 6.2%. On a month-over-month basis, tenders were down 5% as of November 1st, driven by a 5.6% decrease in accepted dry van tenders and a 2.7% increase in accepted reefer tenders.
To provide some context around the changing conditions since the start of the month, accepted tender volumes are up 6%, with both dry van and reefer accepted tender volumes up 3.5% — this mirrors recent DAT spot load trends, indicating volumes are up across both categories, in line with seasonal demand expectations.
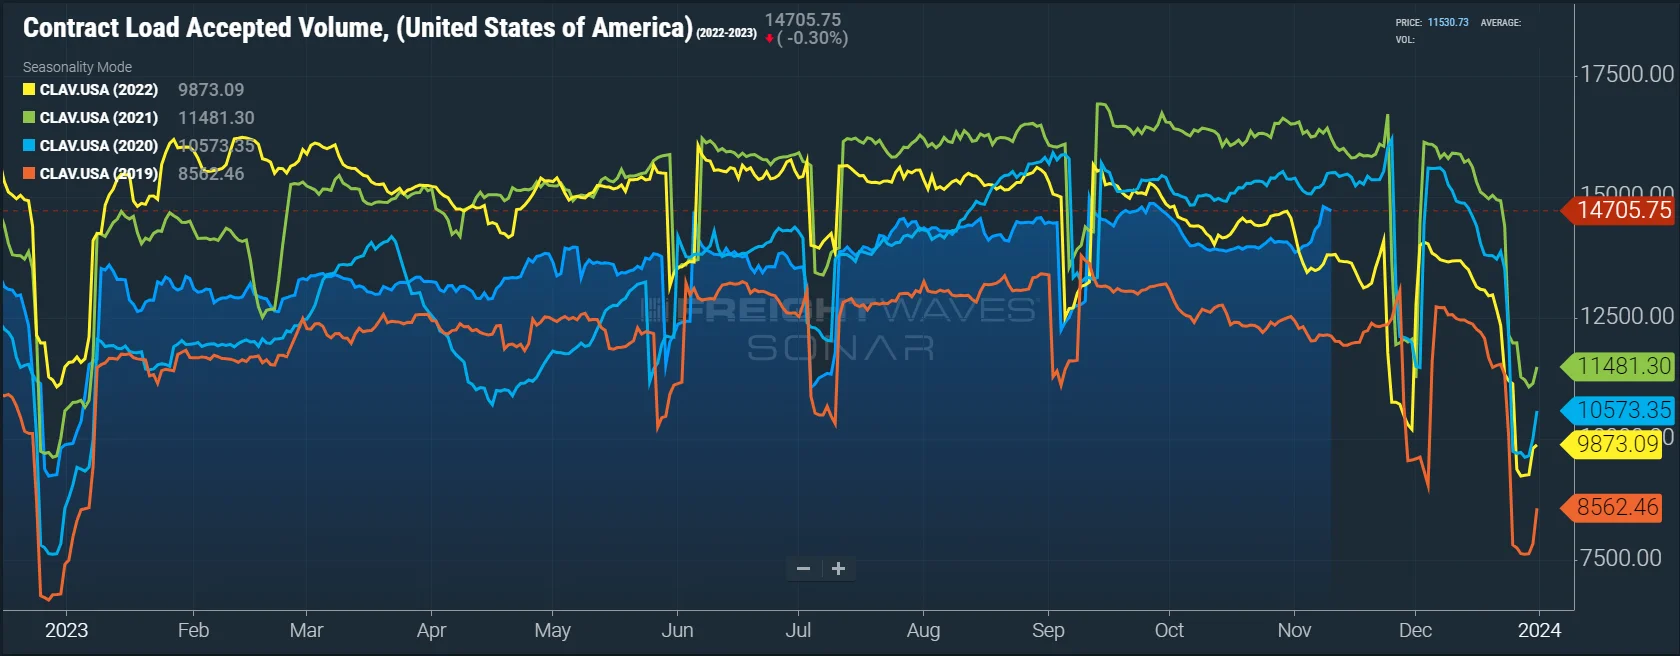 Figure 2: Contract Load Accepted Volume, SONAR: Accepted contract volumes were down 2.6% y/y in early November, but have increased 6% month to date in line with seasonal demand expectations.
Like the reefer tender volume trends reported by FreightWaves, USDA truck shipment data for fresh fruits and vegetables showed pullbacks in total truck shipments and the year-over-year growth rate from a month ago.
In early October, the three-week trend showed total shipments were down 1% year-over-year, with U.S.-grown shipments down 3% and imported crop shipments up 1%. In early November, the three-week trend shows total shipments are down 7% year-over-year, with U.S.-grown shipments down 9% and imports down 5%.
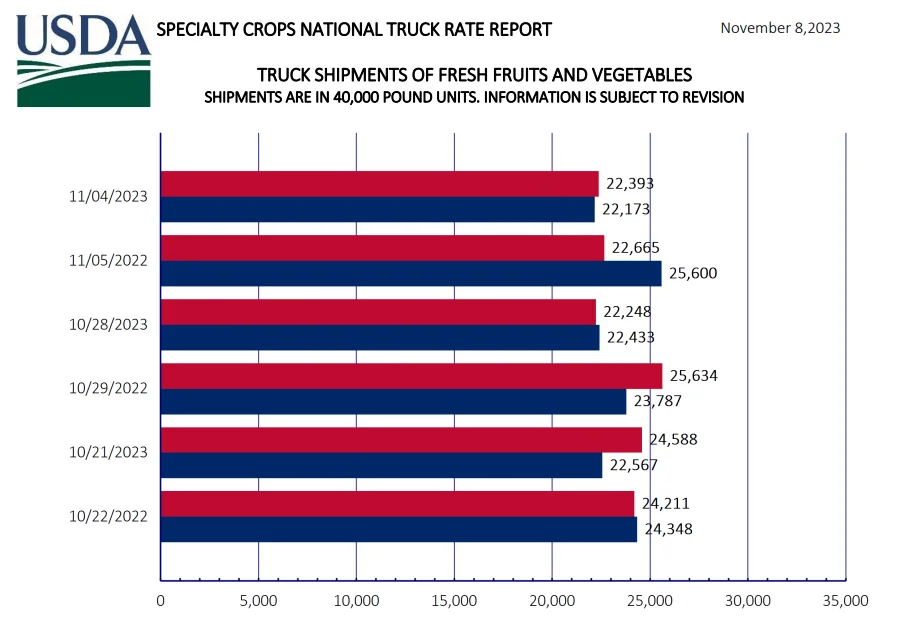 Figure 3: USDA Specialty Crops National Truck Rate Report
The risk of capacity challenges materializing is increasing as Q4 continues. Reefer equipment is already getting tight in mid-November, with dry van tightening expected to follow shortly.
Overall, capacity remains sufficient to support current demand, but seasonal surges are causing regional tender rejection spikes. Similar spikes during the summer peak led to pockets of rate volatility, so we expect this trend to continue through at least year-end.
The Sonar Outbound Tender Reject Index (OTRI) measures the rate at which carriers reject the freight they are contractually required to take. The numbers fluctuated between a high of 3.85% early in the month and a low of 3.46% by month-end, indicating routing guide compliance on shippers’ contractual freight improved further from already historically high levels.
 Figure 4: Outbound Tender Reject Index, SONAR: OTRI remains below 4% and 2019 levels — a sign capacity is still sufficient to support demand and carriers are protecting their contract freight despite increases in spot.
Tender rejections followed a similar pattern for reefer equipment in October but have spiked in the last week from 6% to nearly 9% (and climbing). As early as September, we stated our expectations for reefer equipment challenges ahead of Thanksgiving and Christmas. The volatility associated with the summer peak season was a strong leading indicator that this would happen again in the fourth quarter amid seasonal food demand surges.
 Figures 5 & 6: Van and Reefer Outbound Tender Reject Indices, SONAR: Dry van rejections remain historically low, but a meaningful increase in the baseline for reefer tender rejections is a sign that the market is becoming more vulnerable for the equipment type.
The DAT Load-to-Truck Ratio measures the total number of loads relative to the total number of trucks posted on their spot board. With declining load posts and increasing truck posts, the October ratio reading fell to the lowest point since April.
The Dry Van Load-to-Truck Ratio was down 24.2% month-over-month and remains down 27.6% year-over-year, whereas the Reefer Load-to-Truck Ratio was down 14% month-over-month and 42.3% year-over-year. It is worth noting that the reefer load-to-truck ratio was up 26% in the first week of November compared to the last week of October, validating the trends seen in other reefer indices.
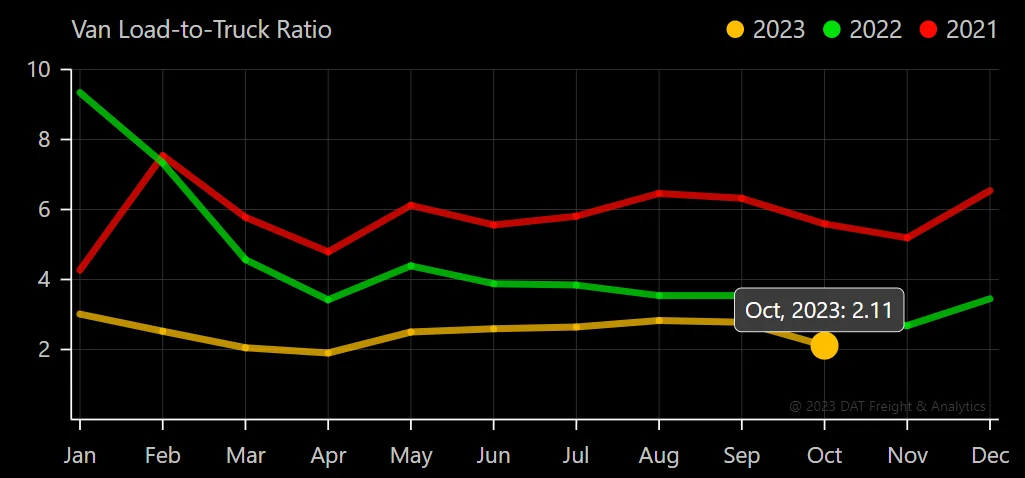 Figure 7: DAT Van Load-To-Truck Ratio
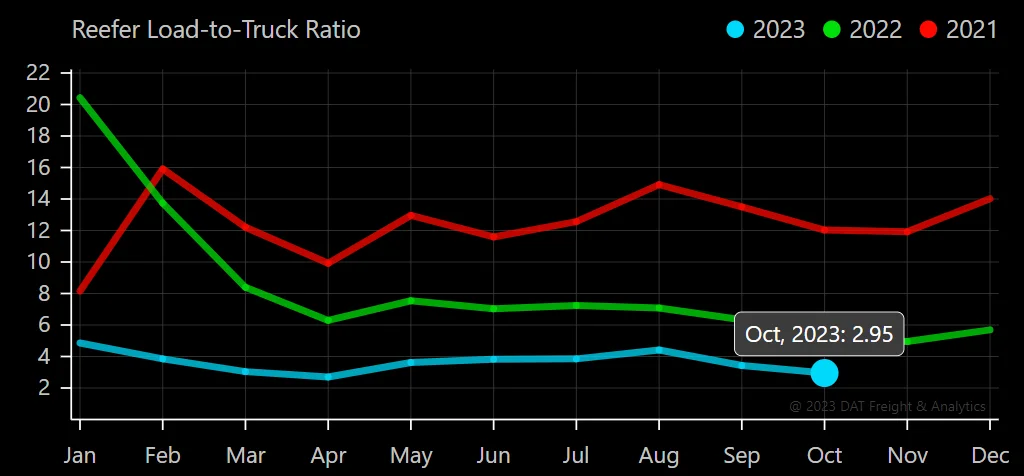 Figure 8: DAT Reefer Load-To-Truck Ratio
The Morgan Stanley Dry Van Freight Index is another measure of relative supply; the higher the index, the tighter the market conditions. The black line with triangle markers on the chart provides a great view of what directional trends would be in line with normal seasonality based on historical data dating back to 2007.
According to the index, October conditions eased in line with historical seasonal patterns, indicating supply is still largely sufficient to support demand. Historical data points to potential tightening from now through the end of the year as seasonal demand picks up in the weeks leading up to Thanksgiving.
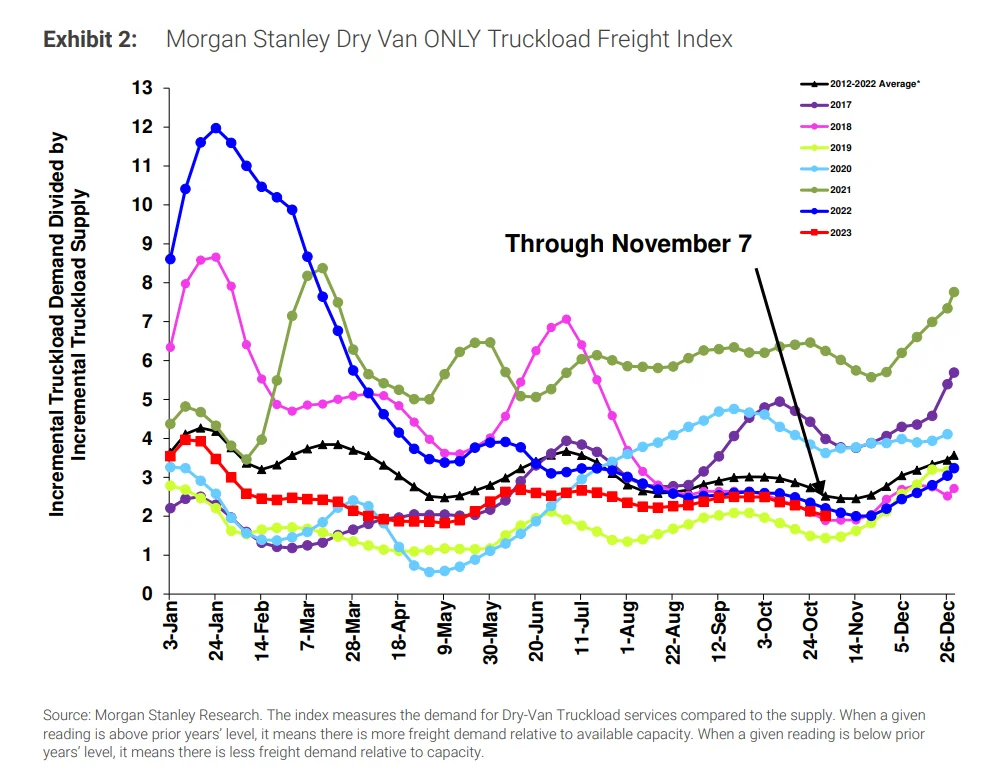
Figure 9: Morgan Stanley Dry Van Truckload Freight Index
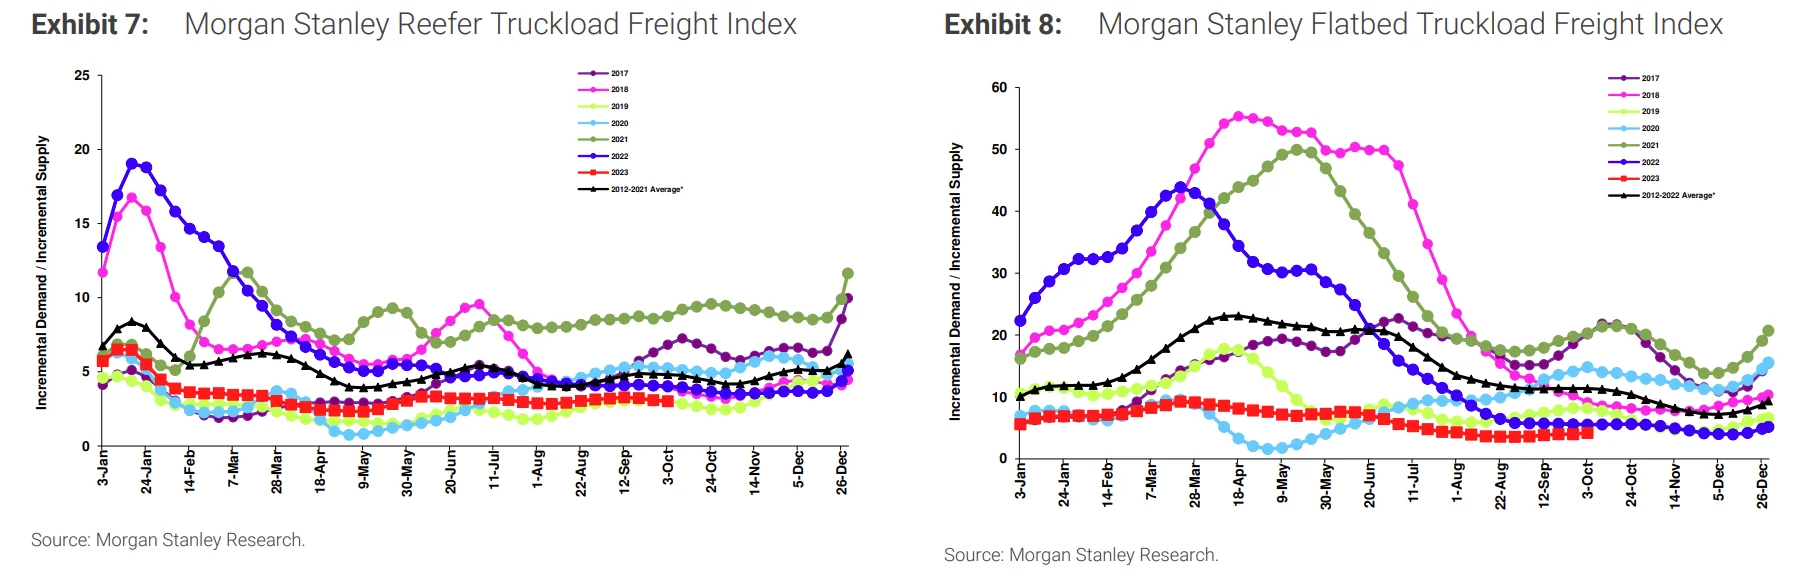 Figures 10 & 11: Morgan Stanley Reefer and Flatbed Truckload Freight Indices
The Truckstop Weekly National Average Spot Rates index provides a detailed view of week-to-week rate movements and a real-time look into the current rate environment.
While dry van rates appear to have found a firm floor, recent data points to a spike in reefer rates following a seven-week slide from $2.55 to $2.31 per mile, excluding fuel. These rate trends largely match what we have seen in tender rejection and load-to-truck data; however, though conditions softened further in October, rates did not move much lower, a sign that nationwide rates are unlikely to fall from current levels moving forward, even as seasonal demand ebbs and flows.
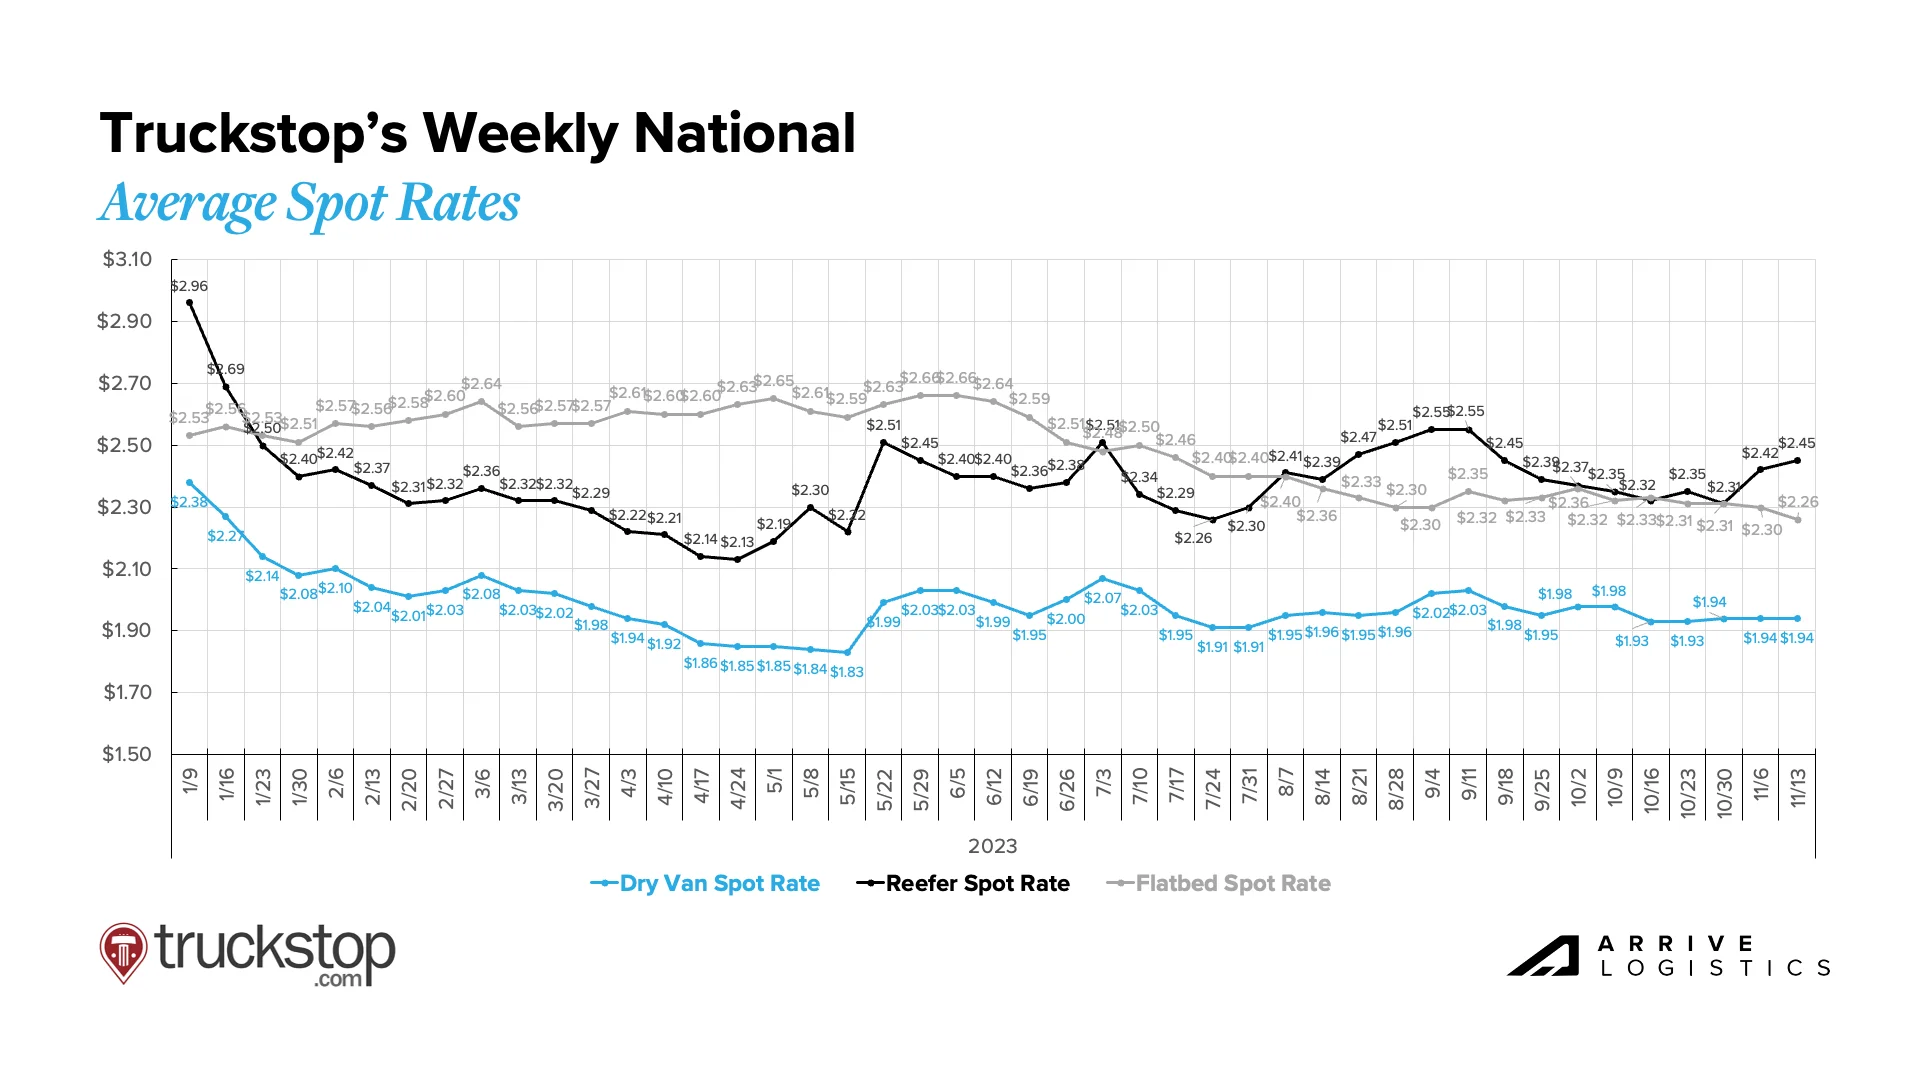
Figure 12: Truckstop Weekly National Average Spot Rates
According to DAT, month-over-month all-in spot rates, including linehaul and fuel costs, are down slightly for van and flatbed equipment and up slightly for reefer in November. Since October, van and flatbed rates are down $0.03 per mile, and reefer rates are up $0.01 per mile. Relatively stable fuel surcharges month-over-month mean that linehaul rates moved closely in line with all-in rates.
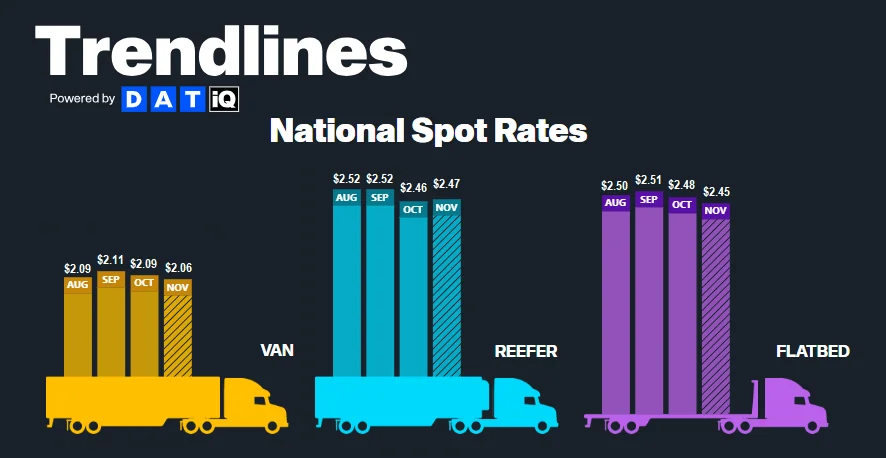 Figure 13: DAT Trendlines National Spot Rates
The month-over-month van rate spread decreased slightly from $0.48 in October to $0.45 month-to-date in November, the lowest reading since deflationary conditions set in during March 2022. Driving the gap’s closure was a $0.06 decline in all-in contract rates, or $0.04 when excluding fuel.
All-in dry van spot rates are down 13.4% year-over-year in November, while linehaul spot rates are down 9.9%, the lowest negative growth rate since April 2022. All-in dry van contract rates are down 17.4% year-over-year, and linehaul contract rates are down 16.0%. These improvements continue to illustrate that peak deflationary pressures are behind us.
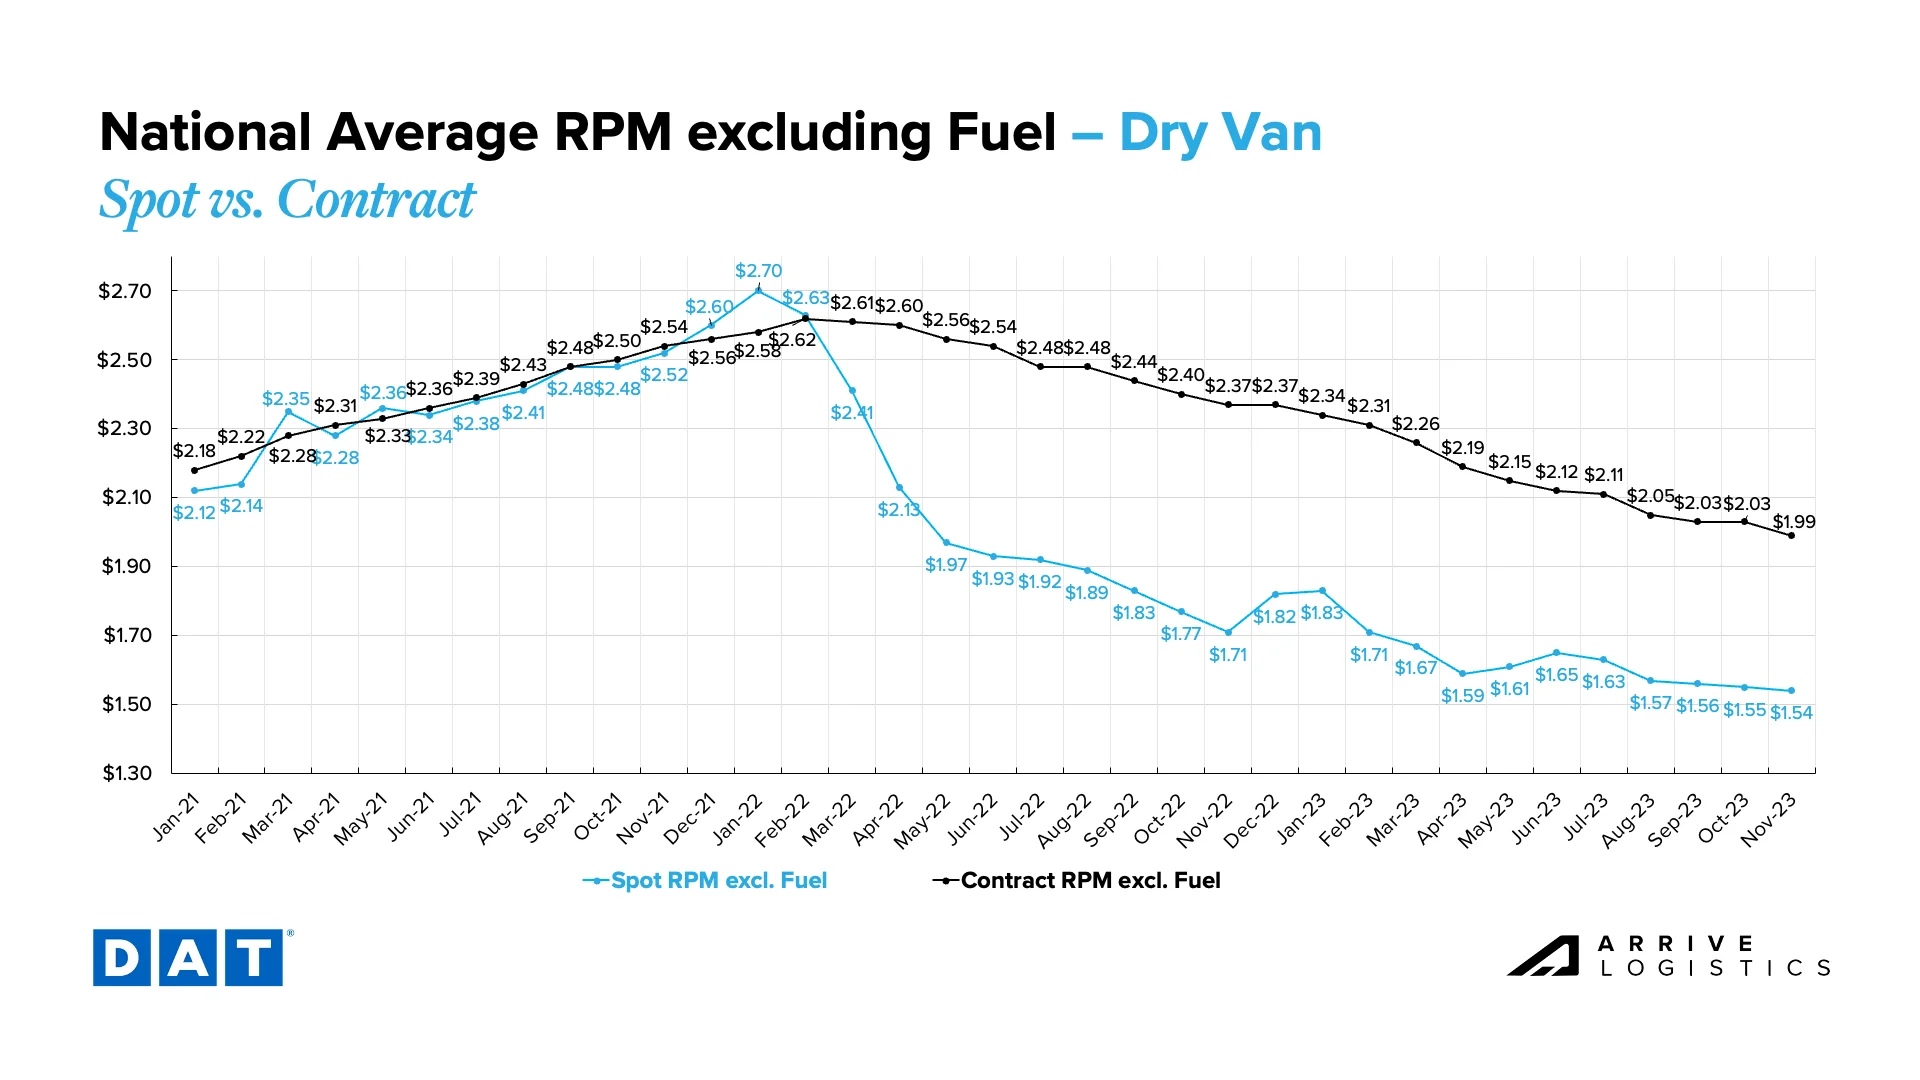 Figure 14: DAT Dry Van National Average RPM Spot vs. Contract
Monthly reefer rates are up in early November following four consecutive months of declines. After hitting a high of $0.58 in April, the reefer spot-contract rate spread is back near year-to-date lows at $0.42 in early November due to the continued downward movement of contract rates and a seasonal spot rate spike. The current reefer contract rate is down 14.0% year-over-year to $2.32 per mile, excluding fuel, while the current reefer spot rate is down 11.5% year-over-year to $1.90 per mile, excluding fuel.
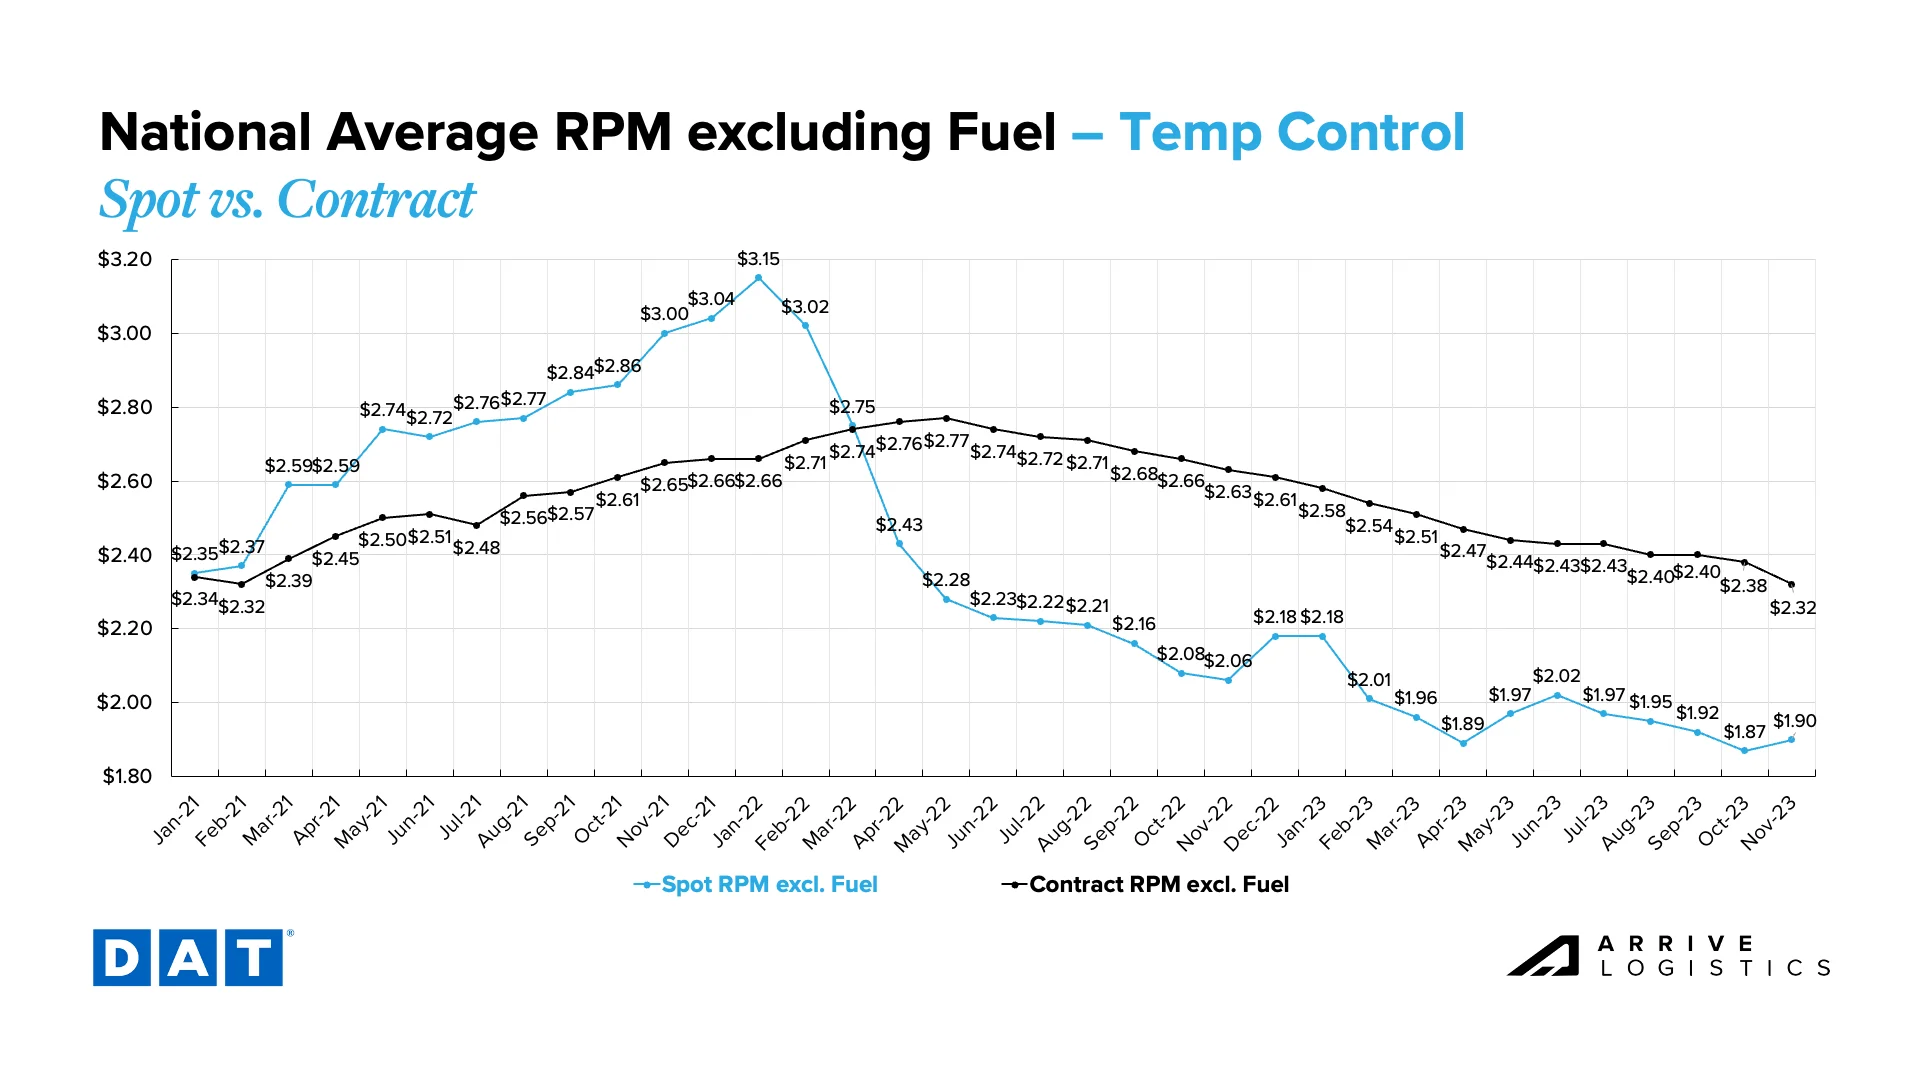 Figure 15: DAT Temp Control National Average RPM Spot vs. Contract
After stabilizing in the first half of 2023, flatbed rates declined rapidly from June through August and have since found a new floor. Contract rates fell similarly, keeping the spot-contract gap at $0.72 per mile after dipping to a cycle low of $0.58 in April. In November, spot rates are currently $1.83 and contract at $2.55 per mile, excluding fuel.
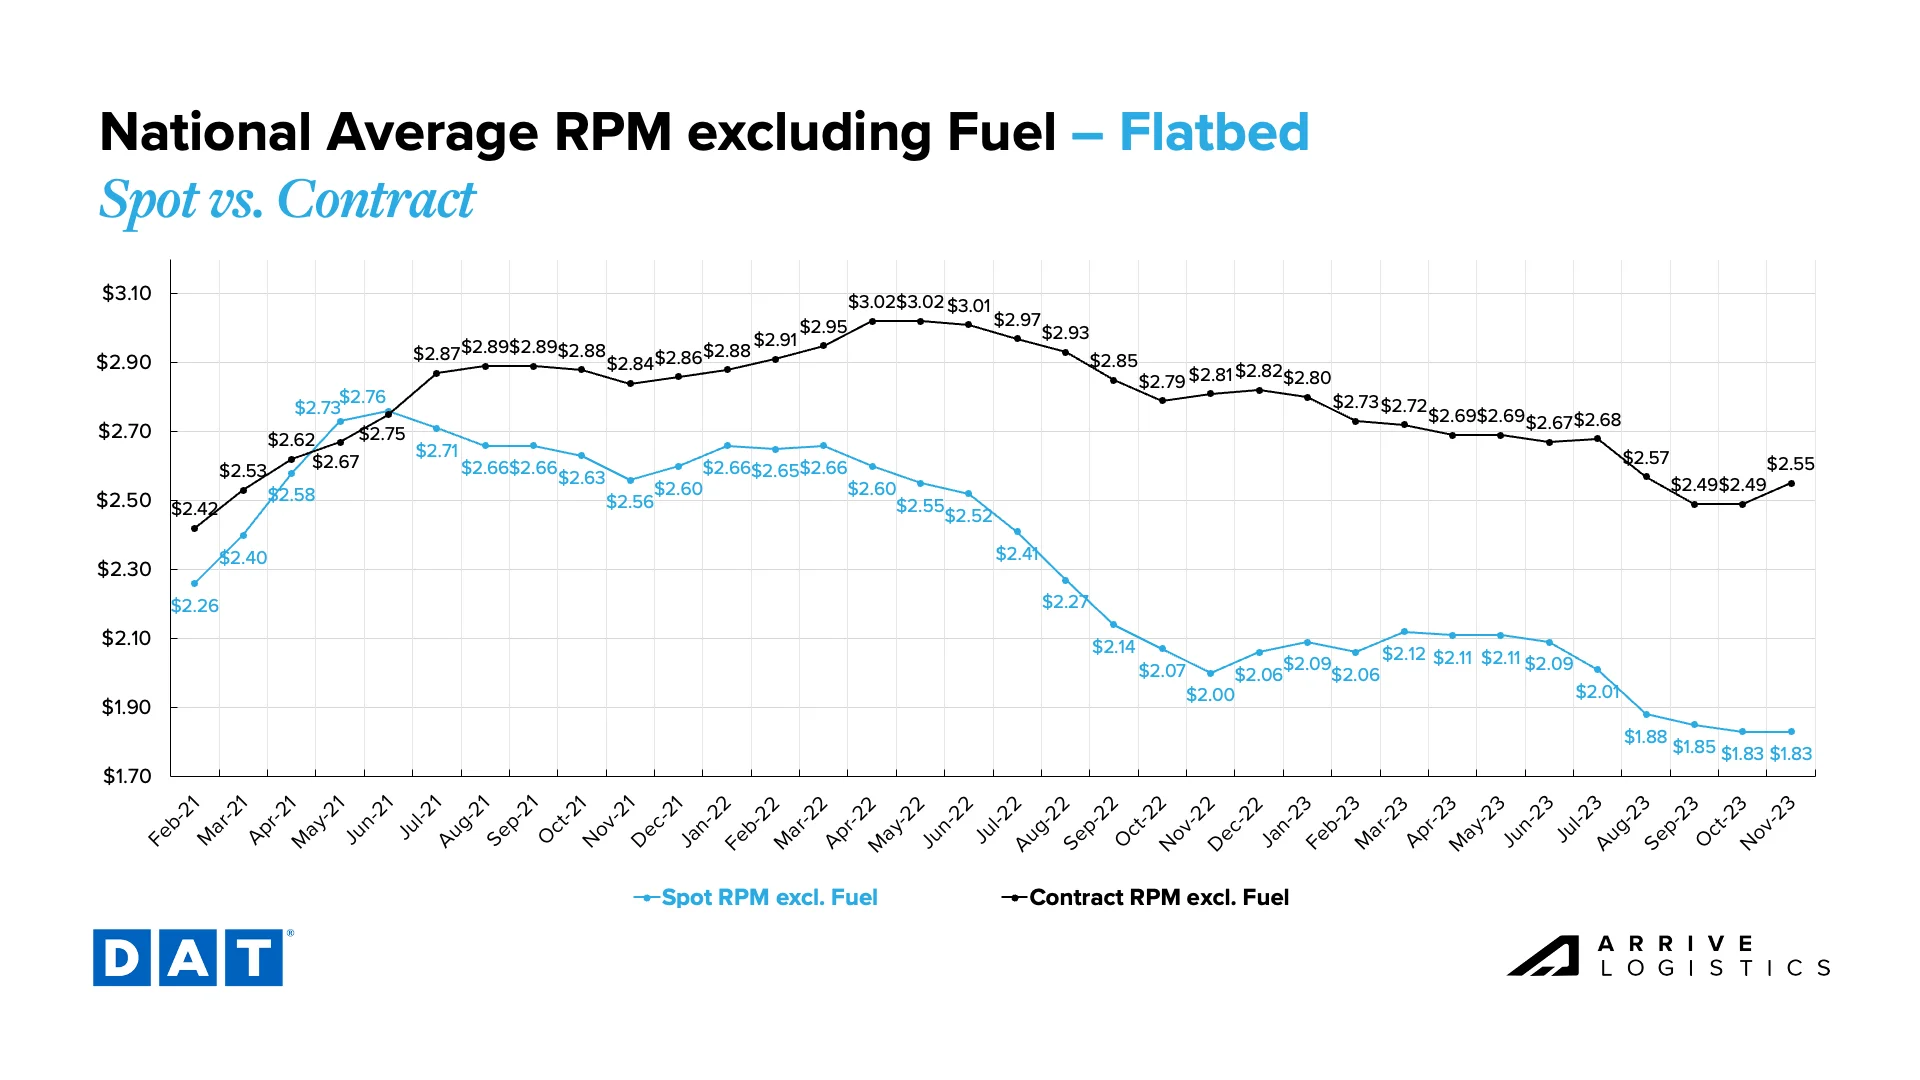 Figure 16: DAT Flatbed National Average RPM Spot vs. Contract
There is some reason to be optimistic from a carrier perspective as we move into the back half of the fourth quarter. However, any rate upticks are likely to be short-lived and tied directly to seasonal demand surges. The first half of the quarter was a much different story and certainly left most carriers worse off. A seasonal bounce back may help delay the inevitable for some, but we expect more capacity to exit the market heading into 2024.
One group does seem to have an advantage: Larger carriers and those running on a majority contractual basis can still operate at mostly profitable rates. They are also less vulnerable to fuel price fluctuations since contract rates are typically negotiated with a variable fuel component.
The fact that some carriers are profitable while many others are struggling makes this market cycle unique. It also makes revocation and employment data difficult to interpret due to larger asset carriers and private fleets continuing to expand their operations. That said, revocation and employment trends represent broader industry momentum swings and show an indisputable shift in where opportunity exists today.
Monthly revocations jumped meaningfully in October and remain highly elevated compared to historical norms. This month, significant revocations again led to a negative net change in the carrier population. Strong contract service numbers indicate the correction is far from over, but this trend will inevitably lead to a capacity crunch, as it always does in the market cycle.
Increased operating expenses are the primary culprit causing carriers to close, as overall rates are still high compared to historical (pre-pandemic) levels. This trend continues to drive record-high revocations of authority, with October totals at the highest levels since May, at just over 7,400 carriers.
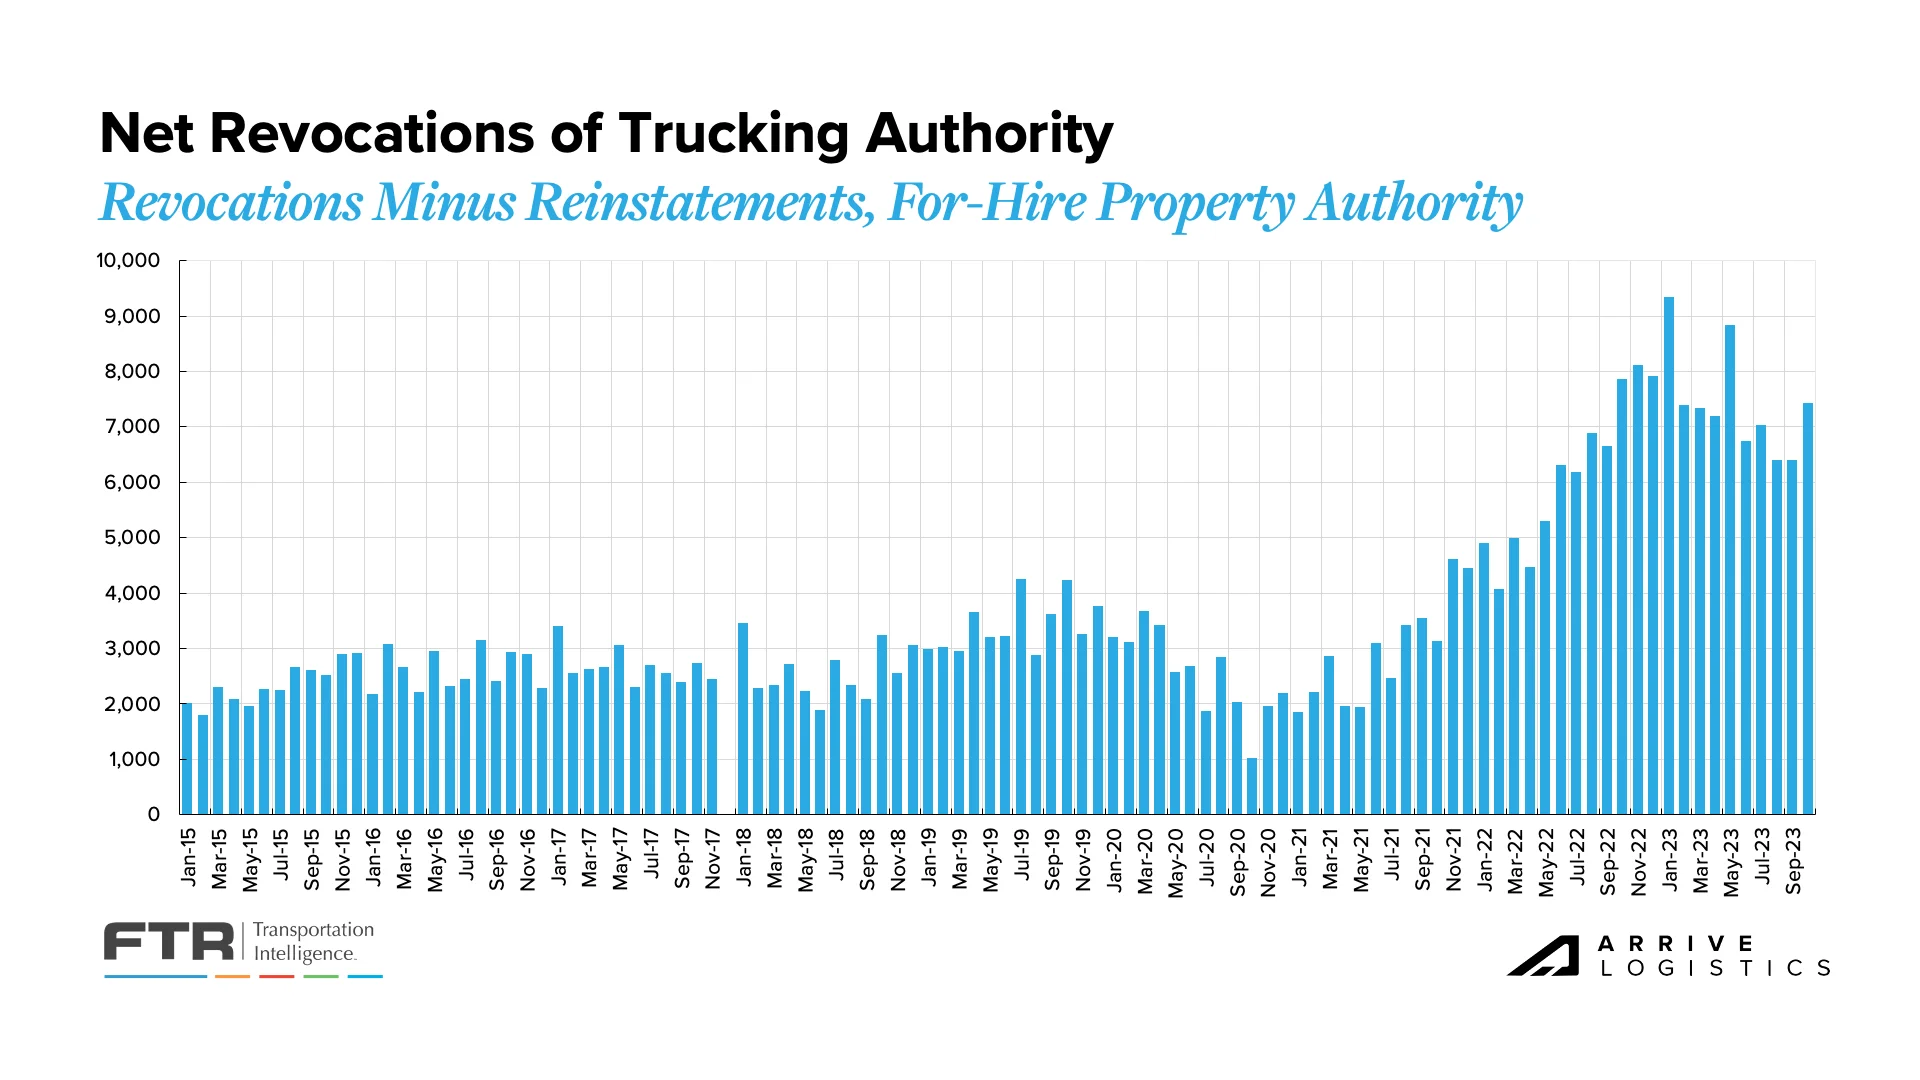 Figure 17: Net Revocations of Trucking Authority: FTR Analysis of FMCSA Data
A key trend we’re still watching is revocations outpacing new carriers entering the market for 12 of the last 13 months, reducing the total number of carriers. Large numbers of drivers entered the market when there was money to be made in the spot market, so balance must be restored before conditions can improve for carriers. With the market still clearly oversupplied, we expect revocations to outpace new entrants for the foreseeable future.
 Figure 18: Net Change in Carrier Population: FTR Analysis of FMCSA Data
New equipment orders typically slow during freight recessions, making the recent spike more intriguing. As OEMs opened up 2024 build slots, carriers quickly secured new orders. While some of this could be due to California-based asset carriers making a run on diesel trucks before they are required to convert their fleets to alternative fuels, this likely points to the financial strength of larger carriers and private fleets’ ongoing investment in growth. It also represents the possibility of a much slower capacity reduction than in previous cycles. Overall, freight demand is healthy, so larger fleets are adding capacity to insource volume back from smaller for-hire fleets and owner-operators.
 Figure 19: New Truck Order, Class 8: FTR Analysis of FMCSA Data
As anticipated, the early Q4 volume lull has given way to more seasonal demand patterns as we move into the back half of November. Volumes will likely be relatively consistent with 2022 levels through year-end. With capacity exiting en masse over the last year, rate volatility should resemble 2022 in a best-case scenario.
The prevailing trend for most of 2023 was seasonally adjusted tonnage growth, largely driven by strong consumer spending that enabled retailers to shift from destocking to normal ordering patterns as the inventory cycle resets. This trend should continue into 2024, at least in the short term, as a strong labor market should enable consumers to continue spending near current levels.
Downside demand risks remain, including concerns about manufacturing trends, how long strong consumer spending will continue, the potential impact of student loan payment resumption on 2024 housing and construction, and the possibility of an extended period of elevated interest rates.
The National Retail Federation (NRF) recently said that retailers expect record-setting sales this holiday season and have their shelves stocked to meet demand, whether in stores or at distribution centers fulfilling online orders.
The fact that inventories are already in position should mean demand surges will be limited, but last-minute challenges are hard to avoid, particularly if the American consumer shows up as expected. Retail imports should also wind down as the year progresses. Heading into 2024, if inventories are depleted, we would expect more normal retail ordering patterns to result in demand increases in the year ahead for retail goods.
If import volumes trend as expected through Q4, the 13.5% year-over-year decline in July could flip to a nearly 7% increase in year-over-year import growth by December. This gives some context to how the inventory cycle’s reset could impact demand and just how large a step back retailers took a year ago to correct their overstocked inventories.
![]()
Figure 20: NRF Monthly Imports
The latest ISM manufacturing report indicated more easing backlogs as new orders contracted for the fourteenth consecutive month. The new orders index contracting faster adds further uncertainty about future backlogs and, in turn, truckload demand. Although backlogs are contracting at an increasing rate, higher production levels indicate the sector still has pent-up demand, which should enable healthy volumes in the near term.
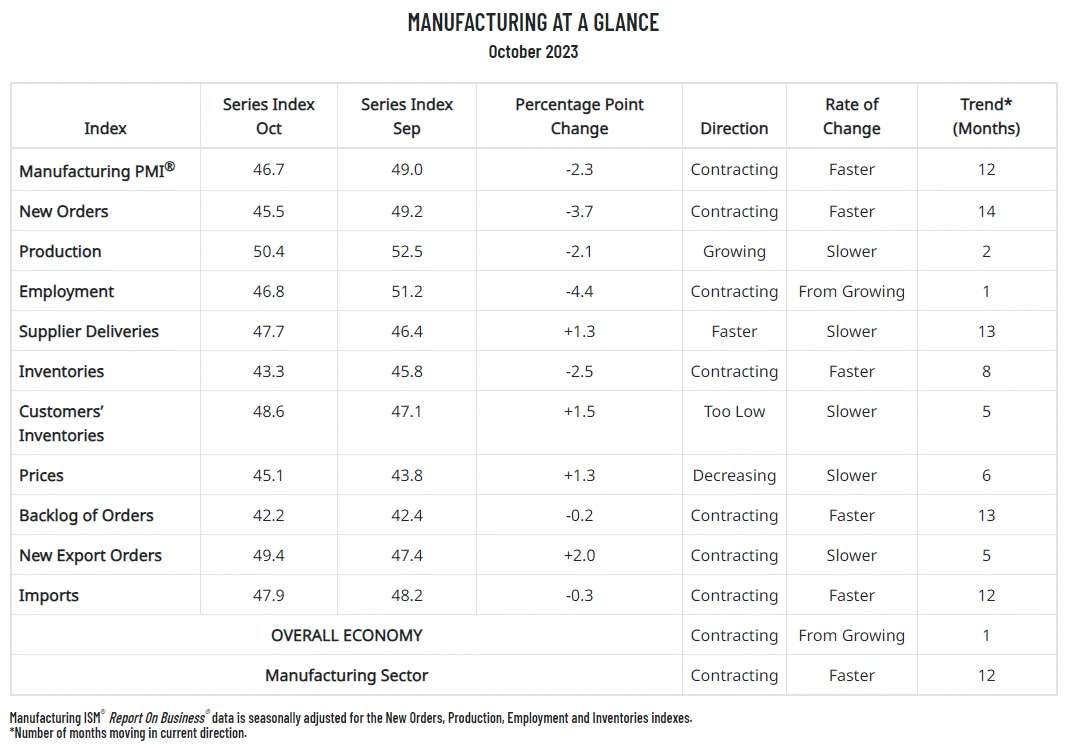 Figure 21: ISM Manufacturing Report, Manufacturing at a Glance
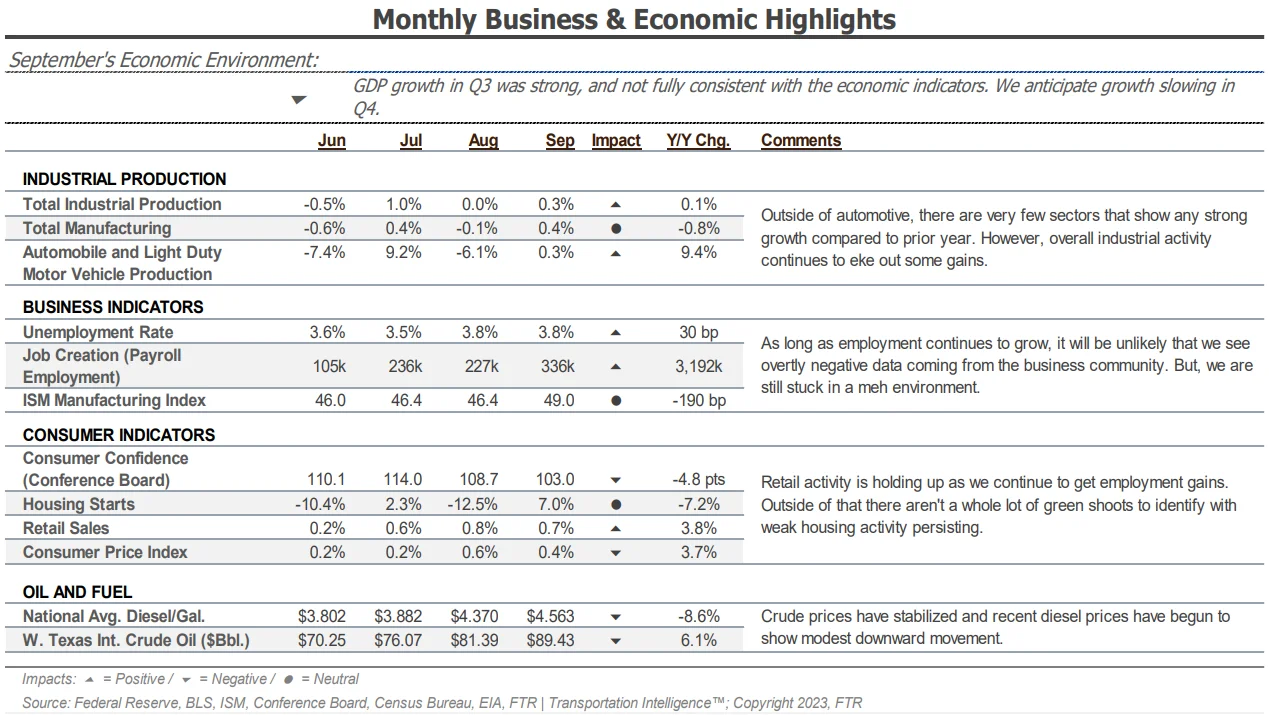 Figure 22: Monthly Business & Economic Highlights
FTR’s latest truck loadings forecast for 2023 increased slightly from 0.1% year-over-year growth a month ago to 0.3%. FTR noted that the latest outlook indicates stronger activity for loadings related to automotive and less negative volumes in consumer goods and food through the end of the year. The 2024 outlook revision showed growth easing from 0.8% to 0.3%, indicating a slightly reduced forecast for the year ahead.
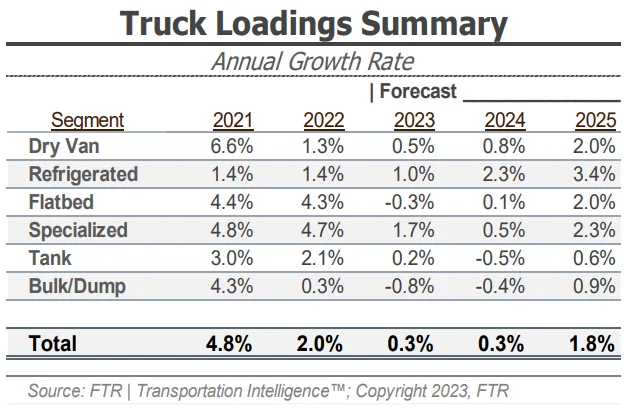 Figure 23: FTR’s Truck Loadings Summary
October CPI data indicated cooling inflation due to lower price pressures on items such as gasoline and airfare. While this is a sign that the economy is moving in the right direction, it remains unlikely that the Fed will lower interest rates during their final meeting this year.
The connection between elevated interest rates and slowing freight volumes is evident when looking at demand for manufacturing and housing commodities — two large sectors that contribute meaningfully to freight demand. With interest rates remaining at a 22-year high, investment in those sectors is declining, and freight demand is following suit. However, the Fed could lower interest rates sometime next year as inflation decreases, which would reignite economic activity and positively impact freight volumes.
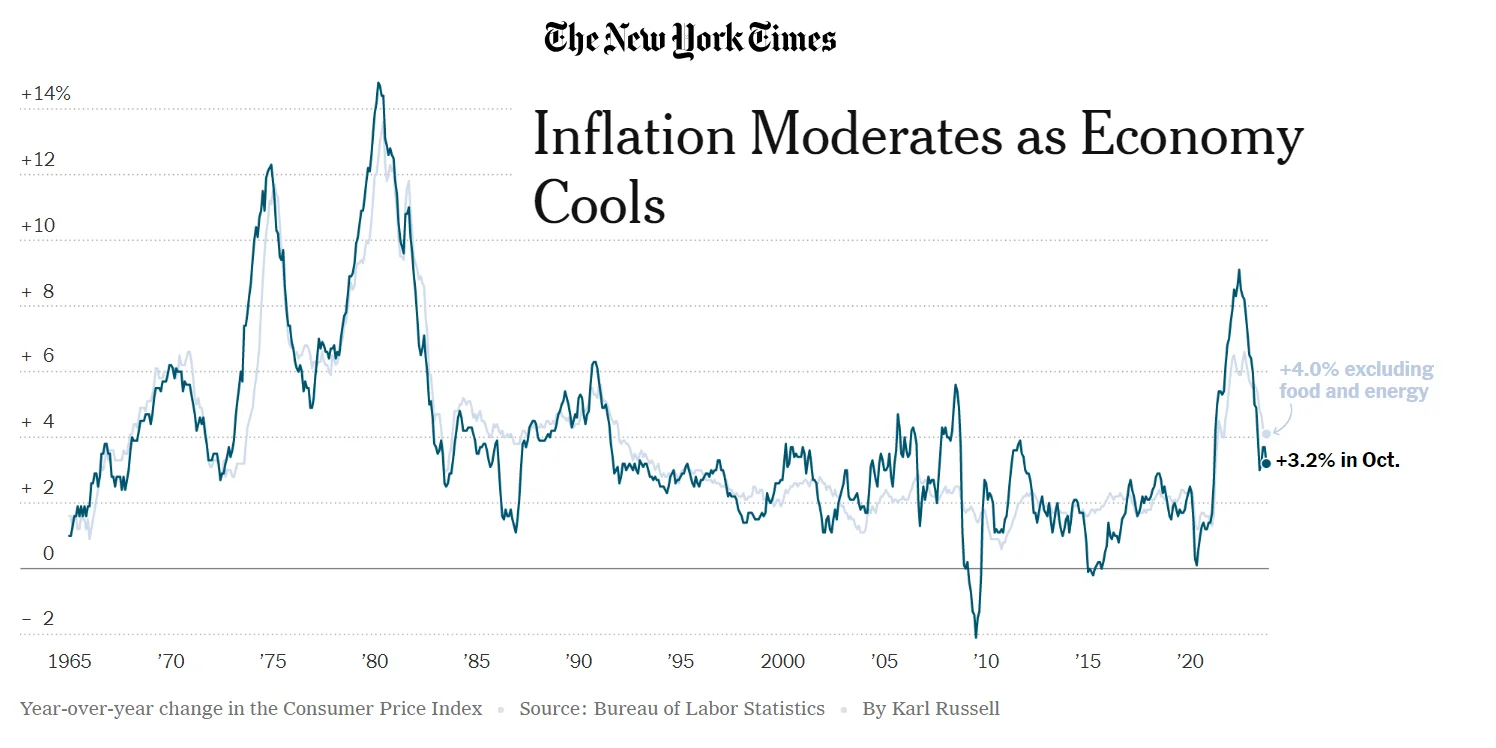 Figure 24: New York Times Inflation Data
The newly established CNBC/NRF Retail Monitor showed that October retail sales, excluding auto and gas, fell by 0.8%. Their core retail metric, which excludes food purchases, fell by 0.3%, indicating consumers are spending more consciously as economic uncertainty looms ahead of the holiday season.
Further, spending was weak across several categories, including gas stations, electronics, appliances and home goods sales. Certain sectors, such as internet sales and sporting goods, did see stronger spending than previous months. While overall consumer spending did cool month-over-month, retail sales were up 2.6% year-over-year; that number will likely rise as retailers anticipate historically high spending this holiday season.
 Figure 25: CNBC/NRF Retail Monitor


