

Canada and the United States share the world’s longest land border, and this proximity facilitates one of the strongest trade partnerships of any two nations. The U.S. was Canada’s largest trading partner in 2022, with over $3.4 billion worth of goods and services crossing that border daily, totaling $1.2 trillion by year-end and accounting for nearly two-thirds of all Canadian trade.
Canadian exports to the U.S. rose by 24.8% to $595 billion in 2022, an all-time high, and the goods flowing between the two countries came from a vast range of industries.
Energy products like mineral fuels and oils surged on strong prices in 2022 and were the top exports to the U.S. In fact, nearly 90% of Canadian energy exports went stateside and comprised one-third of Canada’s total exports to the U.S. This presumably makes American businesses and consumers critical in driving Canadian export volumes and, as a result, southbound cross-border trucking demand.
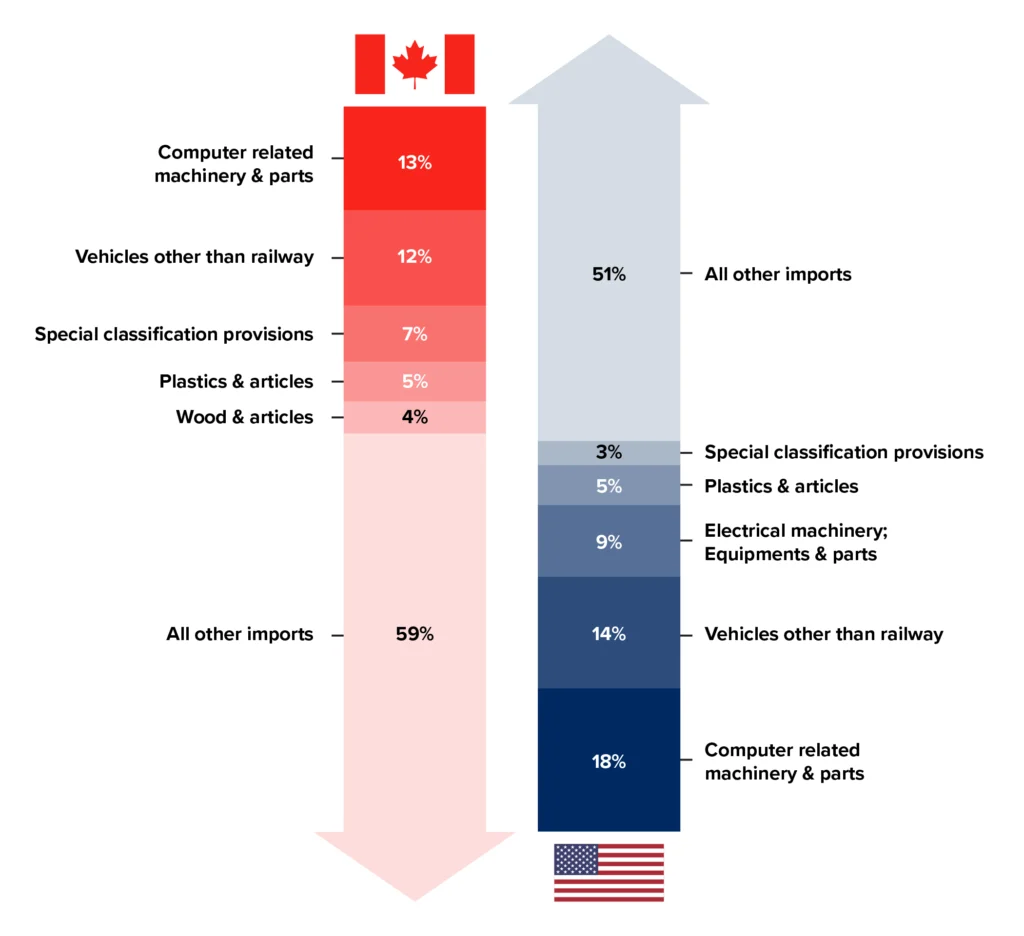
Canadian imports from the U.S. were up 20.0% to $471 billion in 2022. Though energy products like crude oil and refined petroleum posted the largest increase due to higher prices, motor vehicles and parts were still Canada’s top import from the U.S. last year, totaling nearly one-fifth of the country’s $362.9 billion import spend.
The chart below showcases each country’s leading exports that move by truck. A 2023 release from Trucking.org reported truck exports to Canada, as measured by the value of the goods, accounted for 54% of total truck transported trade with the country.
Since exports to the U.S. increased more than imports in 2022, the trade surplus widened from $84 billion in 2021 to $124 billion in 2022, the highest annual surplus with the U.S. on record.
As the trade partnership between Canada and the U.S. grows, so does the demand for logistics service providers. The Canadian 3PL market today is estimated to grow from $28.32 billion to $35.42 billion by 2028, driven by both increasing domestic consumer dependence on shipping in the e-commerce age and the substantial uptick in U.S.-Canada cross-border trade since the implementation of the United States-Mexico-Canada Agreement (USMCA) in July 2020.
That’s precisely why Arrive Logistics opened its first Canadian office in Toronto, Ontario, in October 2023. Founded in 2014 and headquartered in Austin, Texas, Arrive has become a leading multimodal transportation and technology company, and we are proud to support the rapidly growing trade between Canada and the U.S.
Data drives everything we do at Arrive. In fact, every month, our Market Intelligence team releases the Arrive Market Update and Carrier Market Outlook — two best-in-class freight market reports that deliver the data, analysis and expert insights our U.S. customers and carriers need to stay ahead of the curve.
With the launch of our new office and the holiday peak season fast approaching, we’re excited to share this special edition of the Market Update focused exclusively on the Canada-U.S. cross-border freight market. We hope you find it useful in navigating this busy time of year. Have questions? Send an email to: arriveinsights@arrivelogistics.com.
Overall, Canadian market conditions in 2023 closely mirrored those in the U.S., with demand staying relatively steady, albeit lower compared to 2020 and 2021 levels. As consumer patterns have gradually returned to normal, supply and demand conditions have eased in the Canadian freight market. Even regions that would typically experience seasonal demand surges had limited routing guide disruptions due to the capacity surplus.
In July, workers represented by the International Longshore and Warehouse Union Canada (ILWU) at ports in British Columbia went on strike, resulting in backlogs at rail terminals and the Port of Vancouver. While the strike unquestionably impacted certain operations across the country, it did not significantly affect the overall state of the Canadian freight market. However, the repercussions could have been much more significant if the strike occurred during the up-cycle in 2021 or early 2022 as disruptions amid tighter conditions can increase the market’s vulnerability to upside rate fluctuations.
The Loadlink Volumes Index measures trends in the truckload freight spot market based on data from roughly 7,750 Canadian carriers and freight brokers. The latest reading in September showed signs of supply and demand coming back into balance as equipment postings declined and spot volumes rose in back-to-back months for the first time since December 2022-January 2023.
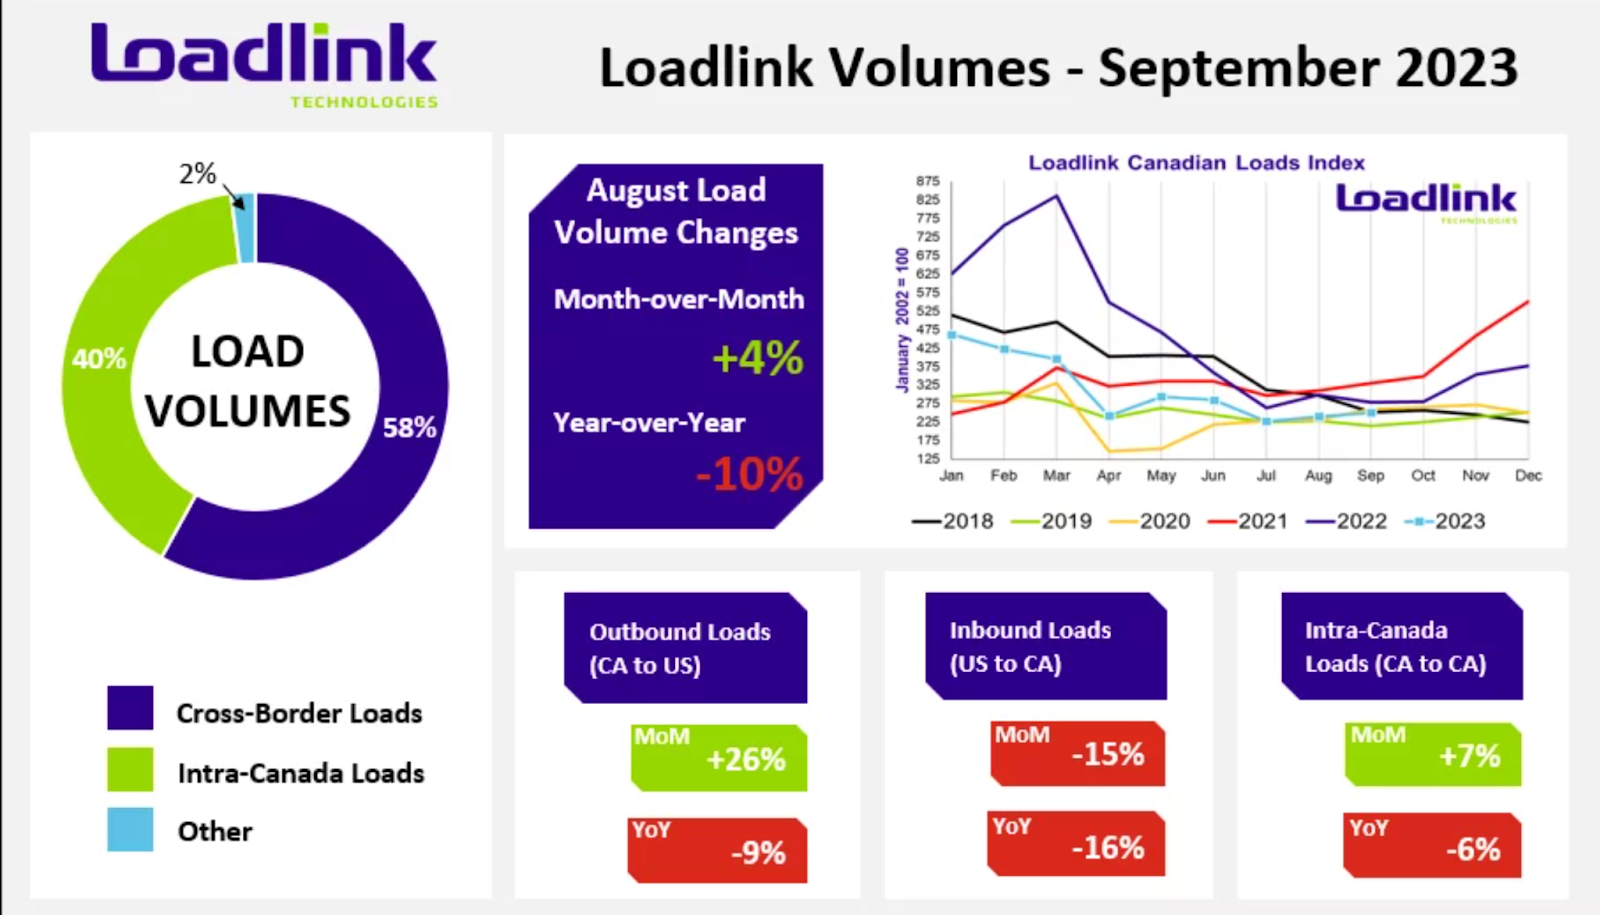
There was a marked difference between outbound and inbound activity, however. Outbound cross-border loads from Canada to the U.S. were up 26% from August but down 9% year-over-year, and equipment postings fell by 17% month-over-month but rose 13% year-over-year. Inbound cross-border loads declined 15% in September after sitting flat in August and were also down 16% year-over-year, while equipment postings fell by 6% month-over-month and increased by 1% year-over-year. When outbound volume significantly exceeds inbound volume for an extended period, it can create capacity imbalances and, in turn, tightness as capacity becomes more scarce. At the very least, these imbalances can drive down the cost of backhauls due to increased northbound carrier demand.
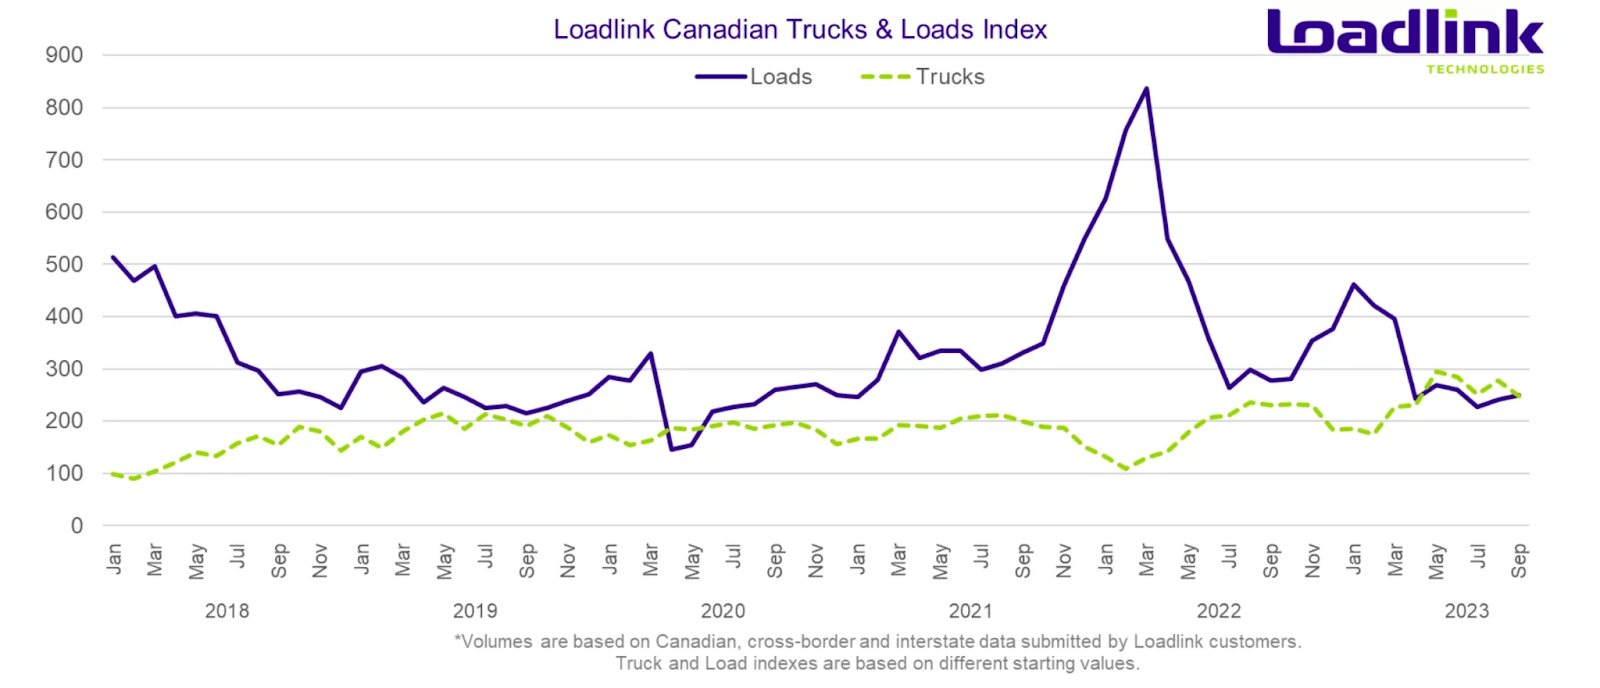
The Loadlink Canadian Trucks & Loads index measures volumes based on Canadian, cross-border, and interstate data submitted by Loadlink customers. In September, the load-to-truck ratio was 4.34 trucks to every load posted on Loadlink, a 14% month-over-month decline from August. Meanwhile, the year-over-year load-to-truck ratio increased by 19% from September 2022.
As Q4 rolls on and we approach the holiday peak season, certain areas will likely experience increased demand, tightness, and rates. However, because the capacity market is still oversupplied and volumes indicate a more muted peak compared to recent years, disruptions will likely be short-lived.
The main challenge for shippers in the near future will be normal seasonal disruptions as soft market conditions will likely continue into at least early 2024. If interest rates and inflation start falling in the second half of 2024, consumers and corporations should be more willing to increase spending, which would positively impact demand.
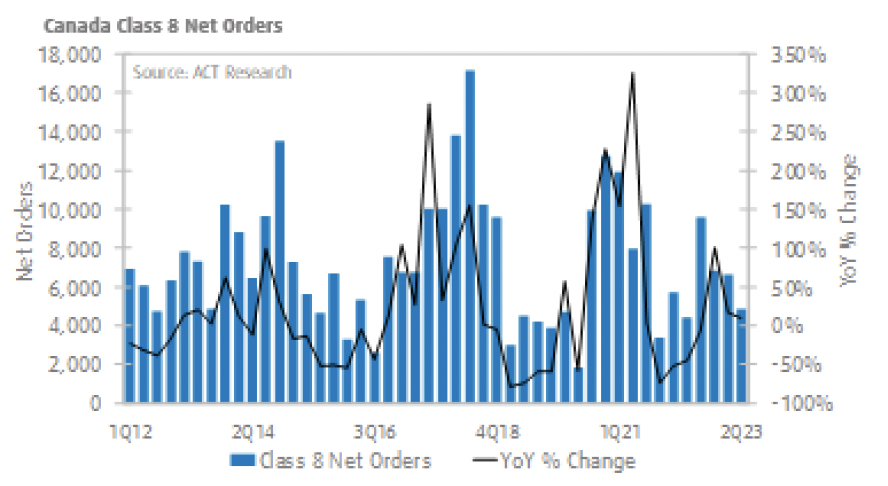
Tight market conditions throughout the pandemic enabled many carriers to realize higher operating margins. Many new carriers entered the market during that period while existing ones expanded their fleets, placing more than 50,000 new Class 8 Truck orders in Canada from Q3 2020 – Q4 2021.
However, as the market flipped over the last 18 months, all that capacity amid a much lower demand environment has resulted in a surplus, leading to plummeting spot rates. High operating costs and diminishing carrier revenue, especially on spot freight, have also contributed to shrinking carrier profits.
The market shift also led to declining Class 8 Truck orders, with just over 10,000 placed in the first half of 2023. Though orders will likely rise again as 2024 build slots open, they should remain well below what they were during the post-pandemic surge. Most carriers with access to contracted freight should still be able to place orders for new equipment, but those with spot market exposure may be stuck with what they have for at least the near term. Slowing orders could eventually lead to a capacity shortage if new orders are insufficient to replace aging vehicles.
Given the oversupplied state of the market, the current down cycle could last longer than in the past. Canadian carriers have been, for the most part, able to endure low rates so far due to earning higher profits between the second half of 2020 and into early 2022. However, an extended period of low spot rates will likely drive more capacity out of the market, especially if operating costs continue to rise.
Aside from brief seasonal blips, spot rates have trended along a floor throughout most of 2023. On the other hand, longer contract terms and infrequent RFP processes have caused contract rates to fall significantly slower than spot rates, creating a large delta between carriers’ earnings in each market. The large and persistent gap between the two will protect the market against disruption until it closes through additional RFP cycles in the coming quarters.
Spot rates should remain relatively low and follow normal seasonality for the remainder of 2023 and into early 2024. As we approach the holidays, increasing demand will drive spot rates up because many carriers choose to take time off, creating a temporary crunch. They will then fall again in the second half of January.
By Q3 of 2024, enough capacity will have left the market to support a more sustainable rate environment, and spot rates will likely begin to increase. Contract rates will likely flatten out, leaving the market vulnerable to disruptions like severe weather, worsening economic conditions, and escalating global tensions.
Consumers remain cautious as persistently high inflation continues. The September inflation rate was 3.8% year-over-year, decelerating from 4.0% in August, driven by lower prices for travel-related services, durable goods, and groceries. While several sectors still report high inflation, the numbers have continued falling since August, resulting in lower rates today. While lower overall, inflation remains well above the ideal target of 2% and continues to pressure consumers and businesses.
Sticky inflation and elevated interest rates are also driving up consumer debt. In August, credit card debt rose by another 0.5% and total credit liabilities of households jumped by 0.3% ($7.9 billion) to $2,877 billion. Real estate and household mortgage debt also saw slight increases. And though the labor market remains relatively stable, increasing pressure on consumers will continue diminishing overall spending and holding down demand.
The national interest rate becomes more likely to stay at 5% as inflation falls further. That likelihood increased again following the recent publishing of retail sales data, which showed volumes dropped by 0.7% in August. British Columbia saw the largest decrease in retail sales out of all territories, with Vancouver reporting a 1.6% drop. Despite signs of economic slowdowns, interest rates of 5.0% remain historically high and will continue to apply downward pressure on consumers.
The freight market remains in flux during the current downcycle. Rates are still down year-over-year, and no true demand push has materialized. Capacity throughout Canada is plentiful, making the market less susceptible to major disruptions such as the labor strike in British Columbia earlier this summer.
Overall, the Canadian freight market continues to grow each year despite ongoing economic uncertainty. That trend will likely continue for the foreseeable future, but potential challenges could limit short-term demand growth. For now, both consumers and businesses remain cautious as high inflation and interest rates continue. Imports are still rolling in, but this holiday season will likely be relatively muted compared to recent years.
Ultimately, the Canadian freight market tends to mirror the United States. For a sustained rate recovery to materialize, significantly more capacity needs to exit the market. This process is already underway as carriers with heavy spot market exposure feel the pressure of declining revenue and increasing operating costs. The trend will likely continue into 2024 as market vulnerability increases amid inflationary market conditions.


